AGGREGATE MONTHLY HOURS WORKED
INTRODUCTION
The recent economic downturn has resulted in an increased focus on Australia's labour market, and in particular on changes in unemployment, employment and the relationship to hours worked. While much of the recent interest has been on movements in the unemployment rate, there is considerable value in analysing other indicators, such as underemployment and hours worked, to better understand the impacts on the labour market.
The ABS produces seasonally adjusted and trend estimates for employment and unemployment, which enable the analysis of month-to-month movements. However, estimates of hours worked have only been produced as original estimates, which limits their usefulness in monitoring movements in hours worked.
In response to the increasing demand for hours worked estimates on a seasonally adjusted and trend basis, the ABS has developed a new measure of hours worked, namely aggregate monthly hours worked, which in future will be available in both seasonally adjusted and trend terms. This new measure of hours worked will complement the existing information on employment and unemployment, assisting analysts in understanding how the labour market is responding to economic challenges, for example, whether employers are reducing employee hours rather than retrenching employees in an attempt to reduce costs.
This article introduces the new aggregate monthly hours worked estimates. These estimates will be included in Labour Force, Australia (cat. no. 6202.0) from the August 2009 reference period onwards (to be released on 10 September 2009).
HOURS WORKED
Current measures
The ABS currently publishes estimates of actual (and usual) hours worked monthly in Labour Force, Australia, Detailed - Electronic Delivery (cat. no. 6291.0.55.001) and quarterly in Labour Force, Australia, Detailed - Electronic Quarterly (cat. no. 6291.0.55.003). Estimates of actual hours worked are produced as original time series and relate to hours worked in the survey reference week, that is, at a point in time.
Aggregate monthly hours worked
To complement the existing weekly actual hours worked original estimates, the ABS has developed estimates of aggregate monthly hours worked, available as seasonally adjusted and trend estimates. This measures the total number of hours worked by employed persons in a calendar month. The methodology used to produce aggregate monthly hours worked means that these are synthetic estimates. Seasonally adjusted and trend estimates of aggregate monthly hours worked are available for the period July 1985 onwards.
Seasonally adjusted aggregate monthly hours worked estimates are produced by combining two series.
The first series is an annual benchmark series containing original estimates of actual hours worked in each financial year from 1985-86 onwards. The annual actual hours worked original estimates are calculated by determining the actual hours worked for each week of the financial year. As actual hours worked are only collected in respect of the reference week of the Labour Force Survey, actual hours worked for weeks not covered by the Labour Force Survey are imputed based on the actual hours worked for the reference weeks in the adjacent months. The imputation accounts for the effect of public holidays on hours worked, that is it accounts for holidays that occur in the reference week of the survey, as well as holidays that occur in weeks other than the reference week of the Labour Force Survey.
The second series is the seasonally adjusted actual hours worked in the reference week, including holiday correction. These estimates provide an indication of movements across months.
These two series are then combined to produce the seasonally adjusted aggregate monthly hours worked series. A trend series is also then produced. This approach ensures that:
- the level of the aggregate monthly hours worked series is consistent with the level of the annual benchmarks, and
- the movements in the series are consistent with the movements in the seasonally adjusted actual hours worked in the reference week series.
INFORMATION PAPER
An information paper providing further information on the methodology used to produce the aggregate monthly hours worked estimates is expected to be released on 8 September 2009. This information paper will also include the results of investigations into the feasibility of producing additional aggregate monthly hours worked series, for example for males and females, as well as ABS plans for publishing estimates of the total number of hours worked on a quarterly and annual basis.
AGGREGATE MONTHLY HOURS WORKED FOR JULY 2009
In trend terms, the aggregate monthly hours worked by employed people in Australia in July 2009 was 1.52 billion hours (see Table 1). This represents a decrease of 1.5 million hours (or -0.1%) from June 2009 and a decrease of 35.1 million hours (or -2.3%) from July 2008. In seasonally adjusted terms, there was a decrease of 0.4% from June 2009 and a decrease of 2.9% from July 2008.
Aggregate monthly hours worked |
|
 |  | Trend | Seasonally adjusted |
 |  | Level | Monthly movement | Level | Monthly movement |
 |  | million | % | million | % |
|
| July 2006 | 1 480.2 | 0.24 | 1 483.1 | 0.82 |
| July 2007 | 1 506.4 | 0.09 | 1 503.2 | 0.27 |
| 2008 |  |  |  |  |
 | July | 1 551.9 | - | 1 560.9 | 0.79 |
 | August | 1 550.6 | -0.09 | 1 546.0 | -0.96 |
 | September | 1 548.1 | -0.16 | 1 548.6 | 0.17 |
 | October | 1 544.6 | -0.23 | 1 543.6 | -0.32 |
 | November | 1 540.6 | -0.26 | 1 542.3 | -0.08 |
 | December | 1 536.2 | -0.29 | 1 534.1 | -0.53 |
| 2009 |  |  |  |  |
 | January | 1 532.0 | -0.27 | 1 535.2 | 0.08 |
 | February | 1 528.2 | -0.25 | 1 527.1 | -0.53 |
 | March | 1 524.9 | -0.22 | 1 520.6 | -0.43 |
 | April | 1 522.3 | -0.17 | 1 525.4 | 0.32 |
 | May | 1 520.1 | -0.14 | 1 517.4 | -0.53 |
 | June | 1 518.3 | -0.12 | 1 521.8 | 0.29 |
 | July | 1 516.8 | -0.10 | 1 515.2 | -0.43 |
|
| - nil or rounded to zero (including null cells) |
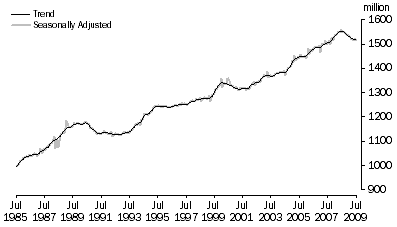
As shown in Figure 1, aggregate monthly hours worked peaked in June 2008 (1.55 billion hours), and has been steadily declining since then. Over the last 24 years, aggregate monthly hours worked has generally trended upwards, with the notable exceptions observed in 1990-92, 2000-01 and 2008-09.
Figure 1. Aggregate monthly hours worked, July 1985 to July 2009

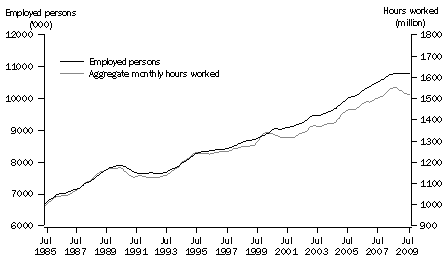
Historically, the decreases in aggregate monthly hours worked have generally coincided with decreases in the employment series (see Figure 2). During the economic downturn that occurred in 1990-92, aggregate monthly hours worked and employment decreased at approximately the same time. However, the recent decrease in aggregate monthly hours worked has been larger (as a percentage) and occurred earlier than the decrease in the employment series.
In 2000-01, the aggregate monthly hours worked series also exhibited an earlier and larger decrease than the employment series. However, this decrease in aggregate monthly hours worked not only reflects a weakening of the labour market in 2000-01, but also the effect of the 2000 Sydney Olympic Games, which had a noticeable impact on aggregate monthly hours worked (they increased prior to the Olympics and then subsequently decreased).
The trend series of aggregate monthly hours worked decreased 35.2 million hours (or -2.3%) between the series high in June 2008 and July 2009. In comparison, trend employment peaked five months later in November 2008, and decreased 0.3% to July 2009.
Figure 2. Aggregate monthly hours worked and employed persons, Trend
- July 1985 to July 2009

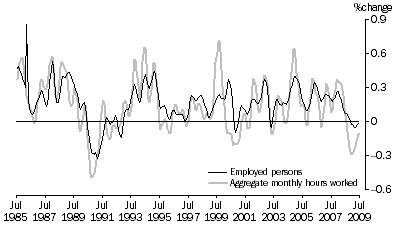
An analysis of the monthly percentage movements for both the trend aggregate monthly hours worked series and the trend employment series (see Figure 3) shows the similar behaviour of the two series, although aggregate monthly hours worked shows more variability. This suggests that employers adjust in the short term to economic fluctuations by altering hours worked as well as taking on additional staff in economic upturns or reducing staff in downturns. Figure 3 also highlights that the recent decrease in aggregate monthly hours worked has been more pronounced than the decrease in employment.
Figure 3. Percentage change in aggregate monthly hours worked and employed persons, Trend
- July 1985 to July 2009

FURTHER INFORMATION
For further information on this article, data supporting the article or the methodology used to construct these estimates, please contact Michael Johnson on (02) 6252 5225 or email <michael.johnson@abs.gov.au>.
For more details on the hours concepts collected in the Labour Force Survey and other labour collections, refer to
Labour Statistics: Concepts, Sources and Methods (cat. no. 6102.0.55.001).
 Print Page
 Print All
 Quality Declaration