GRAPHS
Household final consumption expenditure, (from Table 3.1) Seasonally adjusted
- Chain volume measures
: Quarterly % change
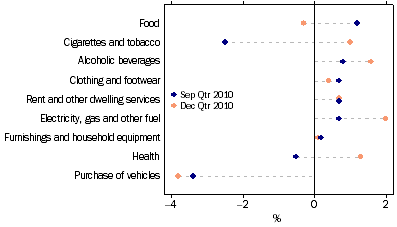
Source: Australian National Accounts: National Income, Expenditure and Product, (cat. no. 5206.0)
Household final consumption expenditure, (from Table 3.1) Seasonally adjusted - Chain volume measures: Quarterly % change
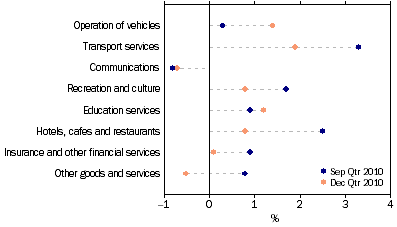
![Graph: Household final consumption expenditure, seasonally adjusted, chain volume measure, quarterly percentage change from table 3.1. Showing current and previous periods.](/AUSSTATS/abs@.nsf/7d12b0f6763c78caca257061001cc588/4942fcd3b4500acdca2578a0001468e3/Body/0.15B4!OpenElement&FieldElemFormat=gif)
Source: Australian National Accounts: National Income, Expenditure and Product, (cat. no. 5206.0)
Retail Trade, (from Table 3.2) Chain volume measures-Percentage change from previous qtr
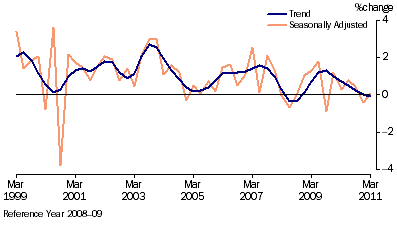
![Graph: Retail Trade, (from Table 3.2) Chain volume measures—Percentage change from previous qtr](/AUSSTATS/abs@.nsf/7d12b0f6763c78caca257061001cc588/4942fcd3b4500acdca2578a0001468e3/Body/0.282C!OpenElement&FieldElemFormat=gif)
Source: Retail Trade, Australia, (cat. no. 8501.0)
Retail Turnover, (from Table 3.3) Percentage change from previous month
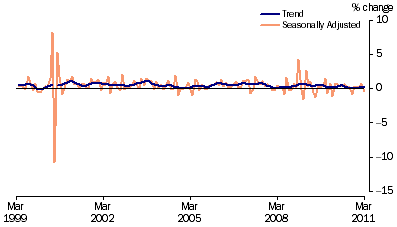
![Graph: Retail Turnover, (from Table 3.3) Percentage change from previous month](/AUSSTATS/abs@.nsf/7d12b0f6763c78caca257061001cc588/4942fcd3b4500acdca2578a0001468e3/Body/0.3C12!OpenElement&FieldElemFormat=gif)
Source: Retail Trade, Australia, (cat. no. 8501.0)
Private gross fixed capital formation, (from Table 3.4) Seasonally adjusted - Chain volume measures
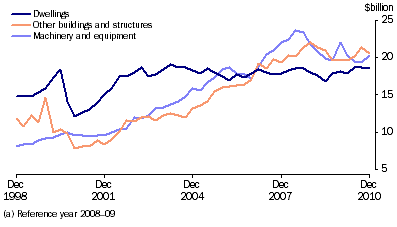
![Graph: Private gross fixed capital formation, seasonally adjusted, chain volume measures from Table 3.4. Showing Dwellings, Other buildings and structures and Machinery and equipment.](/AUSSTATS/abs@.nsf/7d12b0f6763c78caca257061001cc588/4942fcd3b4500acdca2578a0001468e3/Body/0.4BB2!OpenElement&FieldElemFormat=gif)
Source: Australian National Accounts: National Income, Expenditure and Product, (cat. no. 5206.0)
New motor vehicle sales, (from Table 3.8) Total vehicles - Long term
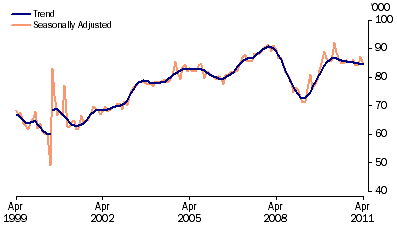
![Graph: New motor vehicle sales, total vehicles, long term from table 3.8. Showing Trend and Seasonally adjusted.](/AUSSTATS/abs@.nsf/7d12b0f6763c78caca257061001cc588/4942fcd3b4500acdca2578a0001468e3/Body/0.5F74!OpenElement&FieldElemFormat=gif)
Source: Sales of New Motor Vehicles, Australia, (cat. no. 9314.0)