AUSTRALIAN CAPITAL TERRITORY
In 2017-18:
- The number of people living in the Australian Capital Territory (ACT) increased by 8,900 (2.2%).
- The ACT's growth rate remained unchanged from 2016-17.
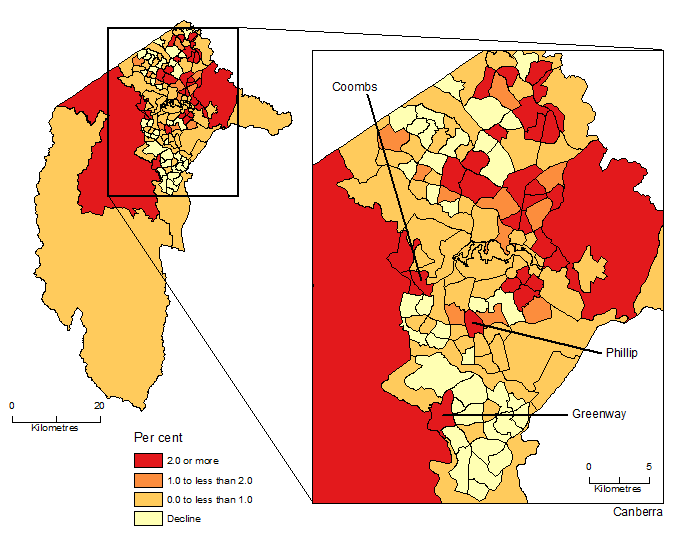
Largest growth areas: The Statistical Areas Level 2 (SA2s) of Moncrieff (up by 1,800 people) and Lawson (1,000), both in Canberra's north.
Fastest growth areas: Greenway in Canberra's south, and the new western suburb of Coombs (both 19%).
SA2s WITH LARGEST AND FASTEST POPULATION GROWTH, Australian Capital Territory |
|
 |  | ERP AT 30 JUNE | POPULATION CHANGE |
 |  | 2018 | 2017-2018 |
| SA2 | SA3 | no. | no. | % |
LARGEST GROWTH |
|
| Moncrieff | Gungahlin | 2 788 | 1 797 | 181.3 |
| Lawson | Belconnen | 1 754 | 1 045 | 147.4 |
| Coombs | Molonglo | 2 940 | 461 | 18.6 |
| Belconnen | Belconnen | 7 544 | 407 | 5.7 |
| Kingston | South Canberra | 5 693 | 390 | 7.4 |
| Greenway | Tuggeranong | 2 439 | 387 | 18.9 |
| Harrison | Gungahlin | 8 775 | 333 | 3.9 |
| Phillip | Woden Valley | 3 700 | 318 | 9.4 |
| Wright | Molonglo | 3 504 | 280 | 8.7 |
| Franklin | Gungahlin | 7 344 | 276 | 3.9 |
FASTEST GROWTH(a) |
|
| Greenway | Tuggeranong | 2 439 | 387 | 18.9 |
| Coombs | Molonglo | 2 940 | 461 | 18.6 |
| Phillip | Woden Valley | 3 700 | 318 | 9.4 |
| Wright | Molonglo | 3 504 | 280 | 8.7 |
| Kingston | South Canberra | 5 693 | 390 | 7.4 |
| Belconnen | Belconnen | 7 544 | 407 | 5.7 |
| Crace | Gungahlin | 5 148 | 232 | 4.7 |
| Campbell | North Canberra | 3 609 | 154 | 4.5 |
| Griffith | South Canberra | 5 064 | 213 | 4.4 |
| Braddon | North Canberra | 6 107 | 251 | 4.3 |
|
| (a) Excludes SA2s with less than 1,000 people at June 2017. |
POPULATION CHANGE BY SA2, Australian Capital Territory - 2017-18

 Quality Declaration
  Print Page
 Print All