Jobs
Filled jobs in Australia grew by 0.2% in the March quarter 2019, following a 1.3% rise in the December quarter 2018. Filled jobs grew 2.8% through the year in seasonally adjusted terms.
Labour Account Filled Jobs, Proportion by Industry, March quarter 2019

Industry | 
Labour Account
Filled Jobs
March qtr 2019
('000)
| 
Proportion of Total
All Industries
March qtr 2019
(%)
|

Agriculture, forestry and fishing (A) | 
481.9 | 
3.4 |

Mining (B) | 
178.5 | 
1.3 |

Manufacturing (C) | 
879.3 | 
6.2 |

Electricity, gas, water and waste services (D) | 
108.3 | 
0.8 |

Construction (E) | 
1,203.1 | 
8.5 |

Wholesale trade (F) | 
563.4 | 
4.0 |

Retail trade (G) | 
1,379.0 | 
9.7 |

Accommodation and food services (H) | 
1,102.2 | 
7.8 |

Transport, postal and warehousing (I) | 
688.6 | 
4.9 |

Information media and telecommunications (J) | 
186.3 | 
1.3 |

Financial and insurance services (K) | 
455.1 | 
3.2 |

Rental, hiring and real estate services (L) | 
292.4 | 
2.1 |

Professional, scientific and technical services (M) | 
1,217.4 | 
8.6 |

Administrative and support services (N) | 
851.8 | 
6.0 |

Public administration and safety (O) | 
768.1 | 
5.4 |

Education and training (P) | 
1,146.5 | 
8.1 |

Health care and social assistance (Q) | 
1,867.5 | 
13.2 |

Arts and recreation services (R) | 
248.6 | 
1.8 |

Other services (S) | 
577.6 | 
4.1 |

Total All Industries | 
14,195.7 | 
100.0 |
Labour Account Filled Jobs, Percentage Change by Industry, March quarter 2019
| Industry | Trend | Seasonally Adjusted |
 | Dec qtr 2018 to
Mar qtr 2019
% change
| Mar qtr 2018 to
Mar qtr 2019
% change
|
| Agriculture, forestry and fishing (A) | 0.0 | 1.3 | -0.3 | 0.9 |
| Mining (B) | 0.7 | 3.5 | 0.0 | 1.8 |
| Manufacturing (C) | 0.6 | 1.2 | 1.1 | 1.9 |
| Electricity, gas water and waste services (D) | 0.2 | 2.8 | -1.6 | 0.6 |
| Construction (E) | 0.4 | 4.7 | -0.2 | 4.7 |
| Wholesale trade (F) | 1.8 | 5.6 | 0.9 | 5.3 |
| Retail trade (G) | 0.4 | 1.8 | 0.1 | 1.8 |
| Accommodation and food services (H) | -0.6 | -3.0 | 0.0 | -0.7 |
| Transport, postal and warehousing (I) | 0.9 | 3.5 | -1.9 | 1.8 |
| Information media and telecommunications (J) | -0.6 | 0.6 | -1.8 | -2.3 |
| Financial and insurance services (K) | 1.1 | 4.7 | 1.8 | 5.9 |
| Rental, hiring and real estate services (L) | 0.4 | -2.1 | 1.1 | -2.0 |
| Professional, scientific and technical services (M) | 1.9 | 8.5 | 2.9 | 10.1 |
| Administrative and support services (N) | -2.2 | -7.8 | -2.9 | -8.7 |
| Public administration and safety (O) | 0.3 | 1.7 | -0.2 | 1.3 |
| Education and training (P) | 1.1 | 4.3 | 0.3 | 4.0 |
| Health care and social assistance (Q) | 1.2 | 6.8 | 0.5 | 6.4 |
| Arts and recreation services (R) | 1.0 | 3.3 | 4.2 | -1.5 |
| Other services (S) | 2.5 | 4.9 | -6.3 | 7.4 |
| Total All Industries | 0.6 | 2.7 | 0.2 | 2.8 |
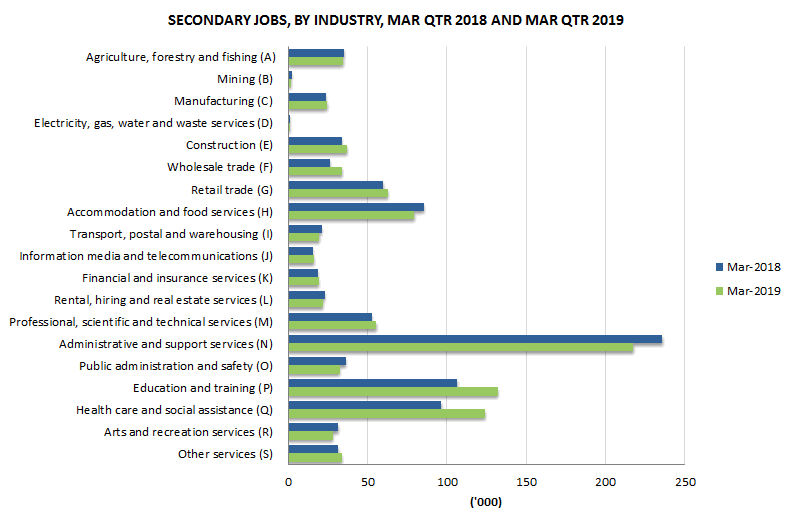
Secondary jobs
Secondary jobs are where a person is working more than one job at the same time, and may consist of one or more additional jobs. These jobs can be held by persons who have their main job in the same or a different industry. The proportion of secondary jobs to filled jobs was 6.9% in the March quarter 2019 and 7.2% in the previous quarter.
The top three industries who have the highest number of secondary jobs in the March quarter 2019 were Administrative and support services, Education and training and Health care and social assistance.

 Quality Declaration
  Print Page
 Print All