Contents >>
The ACT Labour Force: Comparison of Male and Female Participation Rates - Mar 2006
The ACT Labour Force: Comparison of Male and Female Participation Rates
This article presents the results of analysis of labour force statistics for the ACT over the past twenty years. The source of the data is the monthly publication Labour Force, Australia (cat. no. 6202.0). The article compares participation and unemployment rates for males and females in the ACT, focusing on changes for females.
The labour force is all persons that were either employed or unemployed during the survey reference week.
Unemployed persons are those aged 15 years and over who were not employed during the reference week, and:
- had actively looked for full-time or part-time work at any time in the four weeks up to the end of the reference week and were available for work in the reference week; or
- were waiting to start a new job within four weeks from the end of the reference week and could have started in the reference week if the job had been available then.
The unemployment rate is the number of unemployed persons expressed as a percentage of the labour force. The participation rate is the labour force expressed as a percentage of the civilian population 15 years and over.
The data used in this publication is the result of a sample survey, so all the estimates have sample error associated with them. Therefore, some caution should be exercised when interpreting the results, especially month to month variation.
ACT LABOUR FORCE PARTICIPATION RATES
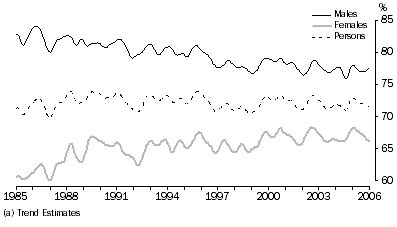
The ACT female participation rate in the labour force has trended higher over the past twenty years (see Graph 1). In January 1985 around 60% of females were participating in the labour force compared to 66% in January 2006. Over the same period the male participation rate has fallen from 83% to 77%.
Graph 1, Participation Rates (a) in the ACT, 1985–2006

This reflects the national trend of male and female participation rates over the period, however the overall participation rates in the ACT have generally been higher than the Australian rate.
DIFFERENCE BY AGE AND SEX
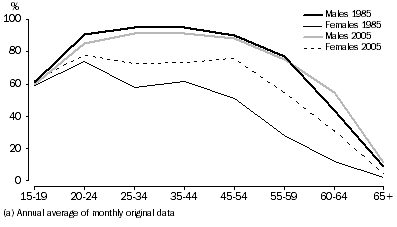
Graph 2 shows that labour force participation varies considerably between age groups, reflecting life phases such as studying, child-raising (particularly for females), and retirement. The differences between age-specific participation rates for the ACT in 1985 and 2005 provide an insight into the changes in overall participation rates for males and females.
The increase in the female participation rate in the ACT over the last 20 years has been apparent across all age groups. The changes in male participation appears to be more complex. There appears to be a slight fall across the prime working ages (25-44 years) between 1985 and 2005. In the older age groups there appears to be a slight increase in participation. This may be reflecting increased part-time participation among older males (see end note 1). These changes are broadly in line with changes at the national level.
Graph 2, Age-specific Labour Force Participation Rates(a) for the ACT, 1985 & 2005

There are a number of factors (see end note 2) which have been associated with these changes in participation at the national level. These include:
- A large decrease (27% between 1983-2003) in the number of females listing 'home duties/childcare' as a main activity across all age groups.
- A high proportion of females with young children are staying in the workforce.
- Changes in the type of employment - higher participation rate but mostly in part-time employment.
- More females returning to the labour force after having children and once there, staying longer.
It is likely that the same factors are influencing the changes in ACT participation rates.
For more information on labour force participation at the national level please refer to Labour Force Participation in Australia, Australian Labour Market Statistics (cat. no. 6105.0). |
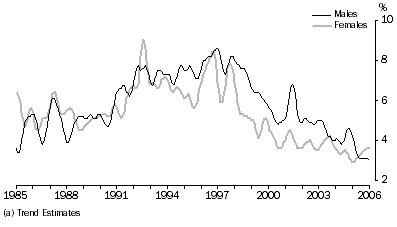
ACT UNEMPLOYMENT RATESThe unemployment rate for both males and females has fallen from a peak of around 8% in November 1997 to around 3% in January 2006. Of particular interest is that the female unemployment rate has been higher than the male unemployment rate over the past 6 months in the ACT.
Graph 3, Unemployment Rate(a) for Males and Females in the ACT, Jan 1985 – Jan 2006

To further investigate this emerging pattern the difference in the unemployment rate for males and females over the past twenty years can be compared. There has been an higher male unemployment rate than female rate over most of the period – October 1996 was the last time the unemployment rate for females was higher than males.
Another interesting point is that whilst the unemployment rate of females in the ACT has been trending upwards in the last 6 months (Graph 3), the participation rate has been trending downwards (Graph 1). This is largely consistent with what has been happening nationally where the unemployment and participation rates have remained constant.
END NOTES
1. Australian Labour Market Statistics: Experimental Estimates of the Average Age at Labour Force Withdrawal, cat. no. 6105.0,
2. Australian Labour Market Statistics: Labour Force Participation in Australia, cat. no. 6105.0,
 Print Page