Balance on current account, (from Table 2.1)
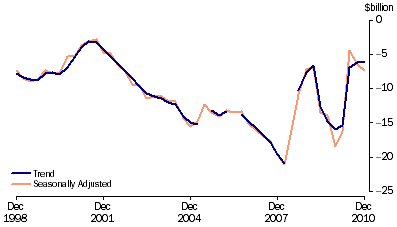
Source: Balance of Payments and International Investment Position, Australia, (cat. no. 5302.0)
Goods, (from Table 2.1) Trend
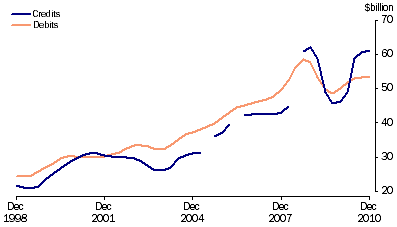
![Graph: Goods, (from Table 2.1) Trend](/AUSSTATS/abs@.nsf/7d12b0f6763c78caca257061001cc588/325d01704fd85dd7ca2578a00014688d/Body/0.11BE!OpenElement&FieldElemFormat=gif)
Source: Balance of Payments and International Investment Position, Australia, (cat. no. 5302.0)
Financial account, (from Table 2.2) Selected types of investment
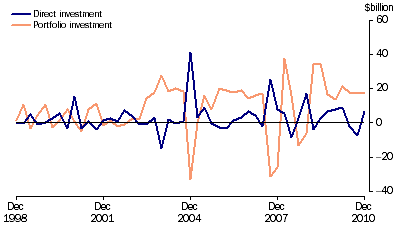
![Graph: Financial account, (from Table 2.2) Selected types of investment](/AUSSTATS/abs@.nsf/7d12b0f6763c78caca257061001cc588/325d01704fd85dd7ca2578a00014688d/Body/0.1FB4!OpenElement&FieldElemFormat=gif)
Source: Balance of Payments and International Investment Position, Australia, (cat. no. 5302.0)
Components of goods credits, (from Table 2.3) Chain volume measure-Seasonally adjusted
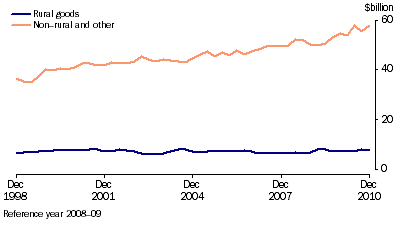
![Graph: Components of goods credits, (from Table 2.3) Chain volume measure—Seasonally adjusted](/AUSSTATS/abs@.nsf/7d12b0f6763c78caca257061001cc588/325d01704fd85dd7ca2578a00014688d/Body/0.3384!OpenElement&FieldElemFormat=gif)
Source: Balance of Payments and International Investment Position, Australia, (cat. no. 5302.0)
Components of goods debits, (from Table 2.3) Chain volume measures-Seasonally adjusted
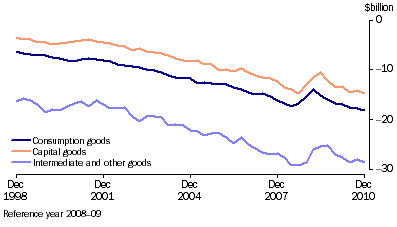
![Graph: Components of goods debits, (from Table 2.3) Chain volume measures—Seasonally adjusted](/AUSSTATS/abs@.nsf/7d12b0f6763c78caca257061001cc588/325d01704fd85dd7ca2578a00014688d/Body/0.4124!OpenElement&FieldElemFormat=gif)
Source: Balance of Payments and International Investment Position, Australia, (cat. no. 5302.0)
Services, (from Table 2.7) Trend
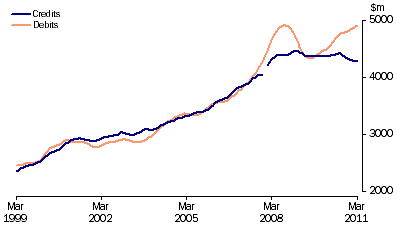
![Graph: Services, (from Table 2.7) Trend](/AUSSTATS/abs@.nsf/7d12b0f6763c78caca257061001cc588/325d01704fd85dd7ca2578a00014688d/Body/0.51E6!OpenElement&FieldElemFormat=gif)
Source: International Trade in Goods and Services, Australia, (cat. no. 5368.0)
Current account to GDP, (from Table 2.11)
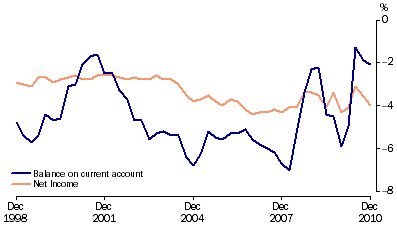
![Graph: Current account to GDP, (from Table 2.11)](/AUSSTATS/abs@.nsf/7d12b0f6763c78caca257061001cc588/325d01704fd85dd7ca2578a00014688d/Body/0.5F4A!OpenElement&FieldElemFormat=gif)
Source: Balance of Payments and International Investment Position, Australia, (cat. no. 5302.0)
Net foreign debt to GDP, (from Table 2.11)
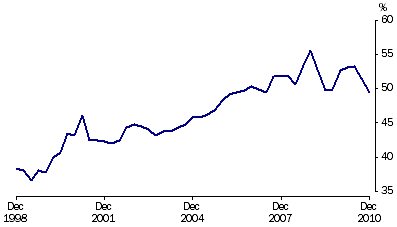
![Graph: Net foreign debt to GDP, (from Table 2.11)](/AUSSTATS/abs@.nsf/7d12b0f6763c78caca257061001cc588/325d01704fd85dd7ca2578a00014688d/Body/0.6FCC!OpenElement&FieldElemFormat=gif)
Source: Balance of Payments and International Investment Position, Australia, (cat. no. 5302.0)
Export shares with selected countries and country groups, (from Table 2.13)
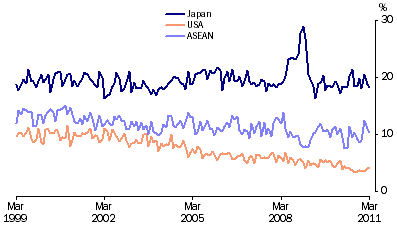
![Graph: Export shares with selected countries and country groups from table 2.13. Showing Japan, USA and ASEAN.](/AUSSTATS/abs@.nsf/7d12b0f6763c78caca257061001cc588/325d01704fd85dd7ca2578a00014688d/Body/0.7BD8!OpenElement&FieldElemFormat=gif)
Source: International Trade in Goods and Services, Australia, (cat. no. 5368.0)
Export shares with selected ASEAN countries, (from Table 2.15)
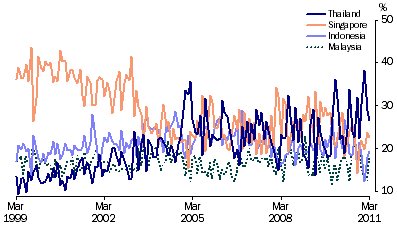
![Graph: Export shares with selected ASEAN countries from table 2.15. Showing Indonesia, Malaysia, Singapore and Thailand.](/AUSSTATS/abs@.nsf/7d12b0f6763c78caca257061001cc588/325d01704fd85dd7ca2578a00014688d/Body/0.911C!OpenElement&FieldElemFormat=gif)
Source: International Trade in Goods and Services, Australia, (cat. no. 5368.0)
Export shares with selected European Union countries, (from Table 2.17)
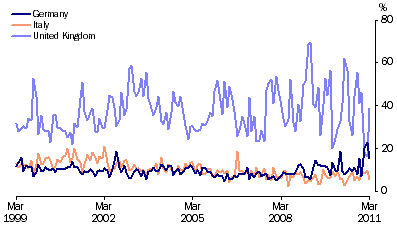
![Graph: Export shares with selected European Union countries from table 2.17. Showing Germany, Italy and UK.](/AUSSTATS/abs@.nsf/7d12b0f6763c78caca257061001cc588/325d01704fd85dd7ca2578a00014688d/Body/1.23F6!OpenElement&FieldElemFormat=gif)
Source: International Trade in Goods and Services, Australia, (cat. no. 5368.0)