SOUTH AUSTRALIA
In 2005-06, the South Australian GSP level represented around 7% of Australian GDP.
Gross state product, South Australia - Chain volume measures(a) |
|  |
 | 2000-01 | 2001-02 | 2002-03 | 2003-04 | 2004-05 | 2005-06 |  |
Values ($m) |  |
|  |
| GSP(A) | 53 366 | 55 578 | 56 411 | 58 908 | 59 626 | 60 714 |  |
| GSP(P) | 53 073 | 55 550 | 56 234 | 59 060 | 59 795 | 60 692 |  |
| GSP(I/E) | 53 659 | 55 605 | 56 589 | 58 756 | 59 457 | 60 737 |  |
| GDP | 784 017 | 813 542 | 839 187 | 873 197 | 896 568 | 921 747 |  |
Percentage changes from previous year (%) |  |
|  |
| GSP(A) | 4.1 | 4.1 | 1.5 | 4.4 | 1.2 | 1.8 |  |
| GSP(P) | 3.6 | 4.7 | 1.2 | 5.0 | 1.2 | 1.5 |  |
| GSP(I/E) | 4.5 | 3.6 | 1.8 | 3.8 | 1.2 | 2.2 |  |
|  |
| (a) Reference year for chain volume measures is 2004-05. |
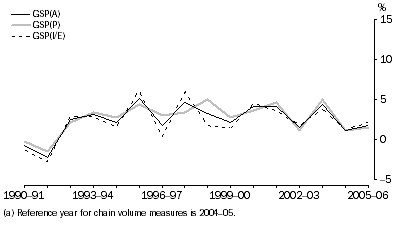
Gross State Product, South Australia
- Chain volume measures(a)
: Percentage changes from previous year

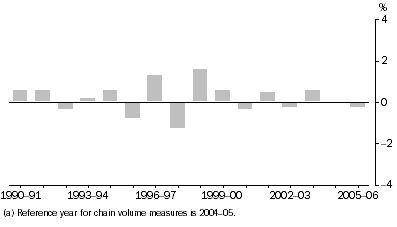
The graph illustrates growth in South Australian GSP(P) is broadly consistent with GSP(I/E) throughout the time series. Between 1996-97 and 1998-99 growth in GSP(P) and GSP(I/E) displayed some large differences, the largest of which was 3.3 percentage points in 1998-99.
Difference between GSP(A) and GSP(I/E), Percentage changes
- South Australia
: Chain volume measures(a)

GSP, South Australia - Chain volume measures(a): Contribution to growth |
|  |
 | 2000-01 | 2001-02 | 2002-03 | 2003-04 | 2004-05 | 2005-06 |  |
 | % pts | % pts | % pts | % pts | % pts | % pts |  |
|  |
| Agriculture, forestry & fishing | 1.4 | 0.4 | -1.7 | 1.5 | -0.4 | 0.7 |  |
| Mining | 0.3 | -0.3 | -0.1 | 0.1 | 0.3 | -0.3 |  |
| Manufacturing | 0.2 | 0.2 | 0.5 | 0.2 | - | - |  |
| Electricity, gas & water supply | - | - | 0.2 | 0.1 | 0.1 | -0.1 |  |
| Construction | -0.6 | 0.5 | 0.9 | 0.3 | 0.3 | 0.2 |  |
| Wholesale trade | -0.2 | 0.5 | 0.1 | 0.2 | - | 0.1 |  |
| Retail trade | 0.2 | 0.4 | 0.3 | 0.1 | 0.2 | - |  |
| Accommodation, cafes & restaurants | 0.2 | 0.1 | 0.2 | 0.1 | -0.1 | - |  |
| Transport & storage | 0.1 | 0.1 | 0.4 | 0.4 | 0.1 | -0.1 |  |
| Communication services | - | 0.1 | 0.1 | 0.1 | 0.1 | 0.2 |  |
| Finance & insurance | 0.8 | 0.3 | -0.5 | -0.3 | -0.1 | 0.5 |  |
| Property & business services | 0.4 | 0.9 | 0.3 | 0.5 | -0.4 | -0.6 |  |
| Government administration & defence | 0.1 | 0.3 | -0.1 | 0.3 | 0.2 | - |  |
| Education | - | 0.2 | 0.1 | - | 0.1 | 0.2 |  |
| Health & community services | 0.4 | 0.3 | 0.3 | 0.2 | 0.3 | 0.3 |  |
| Cultural & recreational services | 0.1 | - | - | 0.1 | 0.1 | - |  |
| Personal & other services | 0.2 | 0.1 | 0.1 | 0.1 | -0.2 | - |  |
| Ownership of dwellings | 0.3 | 0.3 | 0.3 | 0.3 | 0.3 | 0.3 |  |
| Taxes less subsidies on products | -0.2 | 0.4 | 0.4 | 0.3 | 0.2 | 0.1 |  |
| Statistical discrepancy | 0.5 | -0.5 | 0.3 | -0.6 | - | 0.2 |  |
| GSP(A) | 4.1 | 4.1 | 1.5 | 4.4 | 1.2 | 1.8 |  |
|  |
| - nil or rounded to zero (including null cells) |
| (a) Reference year for chain volume measures is 2004-05. |
In 2005-06, the main industries that contributed to South Australian GSP growth were Agriculture, forestry and fishing (0.7 percentage points), Finance and insurance (0.5 percentage points), Health and community services and Ownership of dwellings (both 0.3 percentage points). The main negative contributing industries in 2005-06 were Property and business services (-0.6 percentage points) and Mining (-0.3 percentage points).
 Print Page
 Print All