MINING
Definition and scope
The Mining industry comprises units mainly engaged in mining, in exploration for minerals, and in the provision of a wide variety of services to mining and mineral exploration.
ANZSIC93 Division B, Mining, consists of five sub-divisions:
- Coal mining (sub-division 11)
- Oil and gas extraction (sub-division 12)
- Metal ore mining (sub-division 13)
- Other mining (sub-division 14)
- Services to mining (sub-division 15).
Summary of GSP(P) sources and methods
Sub-divisions 11, 12 and 13 are compiled together, while sub-division 15, Services to mining is compiled separately. Sub-division 14, Other mining, is not compiled for each state due to a lack of consistent state level data. Instead the national total for Sub-division 14 is allocated across states based on Mining GVA movements for all other sub-divisions.
The methodology for Mining uses an output indicator approach to compile state by industry GVA estimates. Mining output volumes are derived by the quantity revaluation method except for Services to mining, which is derived by price deflation. State level value added is compiled for individual mineral groups before being aggregated to division level.
Sub-divisions 11, 12 and 13 use quantity revaluation compiled at the mineral group level (e.g. coal, gold, iron etc.). State production values of each mineral, sourced from the ABS collection Mining Operations, Australia (cat. no. 8415.0), are quantity revalued using production quantities from the same collection. The volume estimates are then used to allocate national value added by mineral across the states. In the most recent year, Mining Operations data are not available. Data from ABARE are used to provide the latest year estimate for each mineral group.
Estimates of sub-division 15, Services to mining, are derived by splitting the national Services to mining value added estimates using state quarterly Business Indicators, Australia (QBIS) (cat. no. 5676.0) turnover data for Services to mining. The estimates are then price deflated using the same deflator used in the quarterly national estimates. This deflator is a combination of seven price indexes. Six components are from ABS Producer Price Indexes, Australia (PPI) (cat. no. 6427.0), and the seventh component, which receives the highest weight, is the wage cost index for the hourly wage rate in the mining industry, obtained from the ABS collection Labour Price Index, Australia (cat. no. 6345.0).
The value added estimates for each state, by each mineral plus Services to mining, are summed to Mining division level and used to derive volume measures of GVA for Mining. The state volume GVAs are benchmarked to the annual national industry volume GVA.
Results for Mining
Mining gross value added(a), Chain volume measures(b) |
|  |
 | 2000-01 | 2001-02 | 2002-03 | 2003-04 | 2004-05 | 2005-06 |  |
Values ($m) |  |
|  |
| New South Wales | 4 918 | 5 019 | 5 004 | 5 373 | 5 603 | 5 386 |  |
| Victoria | 3 487 | 3 506 | 3 174 | 3 110 | 2 777 | 2 585 |  |
| Queensland | 10 757 | 11 390 | 11 241 | 11 631 | 12 571 | 12 437 |  |
| South Australia | 1 387 | 1 203 | 1 123 | 1 170 | 1 356 | 1 192 |  |
| Western Australia | 21 096 | 21 428 | 22 306 | 20 195 | 21 320 | 20 887 |  |
| Tasmania | 267 | 267 | 271 | 286 | 271 | 232 |  |
| Northern Territory | 3 682 | 2 881 | 2 505 | 2 034 | 2 251 | 2 279 |  |
| Australian Capital Territory | - | - | - | - | - | - |  |
| Australia | 45 704 | 45 734 | 45 596 | 43 948 | 46 152 | 45 000 |  |
Percentage changes from previous year (%) |  |
|  |
| New South Wales | 2.0 | 2.1 | -0.3 | 7.4 | 4.3 | -3.9 |  |
| Victoria | -10.2 | 0.6 | -9.5 | -2.0 | -10.7 | -6.9 |  |
| Queensland | 16.4 | 5.9 | -1.3 | 3.5 | 8.1 | -1.1 |  |
| South Australia | 12.8 | -13.3 | -6.6 | 4.2 | 15.9 | -12.1 |  |
| Western Australia | 6.7 | 1.6 | 4.1 | -9.5 | 5.6 | -2.0 |  |
| Tasmania | -22.7 | 0.1 | 1.7 | 5.3 | -5.2 | -14.2 |  |
| Northern Territory | 32.2 | -21.8 | -13.0 | -18.8 | 10.7 | 1.2 |  |
| Australian Capital Territory | - | - | - | - | - | - |  |
| Australia | 7.6 | 0.1 | -0.3 | -3.6 | 5.0 | -2.5 |  |
|  |
| - nil or rounded to zero (including null cells) |
| (a) At basic prices. |
| (b) Reference year for chain volume measures is 2004-05. |
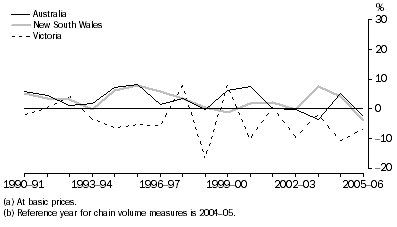
Mining gross value added(a), Chain volume measures(b)-Percentage changes

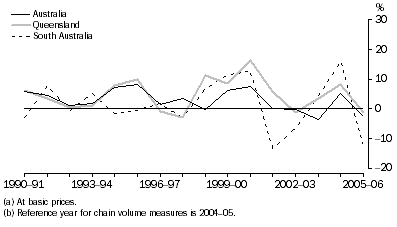
Mining gross value added(a), Chain volume measures(b)-Percentage changes

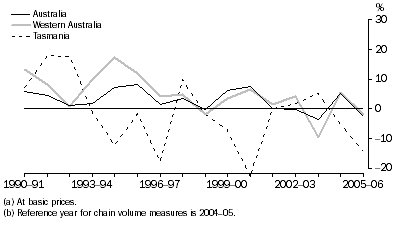
Mining gross value added(a), Chain volume measures(b)-Percentage changes

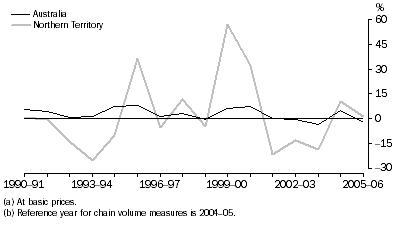
Mining gross value added(a), Chain volume measures(b)-Percentage changes

Western Australia has shown the strongest growth throughout the time series. Queensland has also shown strong growth over the time series with positive growth in seven of the last eight years. Victoria and Tasmania are characterised by an overall decrease in growth while South Australia has displayed variable growth. New South Wales has had fairly flat growth throughout the time series.
The Northern Territory had extremely high growth in 1999-2000 and 2000-01 following the completion of a major mining project, but experienced strong decreases in the following three years due to falling offshore oil production. In 2005-06, Mining decreased in all states except the Northern Territory (up 1.2%) reflecting the overall decrease in Australian GVA for Mining of 2.5%.
Mining gross value added, State shares - Current prices |
|  |
 | 1989-90 | 1994-95 | 1999-00 | 2003-04 | 2004-05 | 2005-06 |  |
 | % | % | % | % | % | % |  |
|  |
| New South Wales | 17.4 | 14.7 | 13.1 | 12.7 | 12.1 | 10.9 |  |
| Victoria | 19.2 | 16.3 | 11.2 | 9.3 | 6.0 | 5.3 |  |
| Queensland | 21.8 | 18.3 | 20.7 | 24.5 | 27.2 | 30.8 |  |
| South Australia | 4.6 | 4.1 | 4.0 | 2.9 | 2.9 | 2.7 |  |
| Western Australia | 29.6 | 41.6 | 44.6 | 44.8 | 46.2 | 45.2 |  |
| Tasmania | 1.6 | 1.3 | 0.8 | 0.6 | 0.6 | 0.5 |  |
| Northern Territory | 5.8 | 3.7 | 5.5 | 5.1 | 4.9 | 4.6 |  |
| Australian Capital Territory | - | - | - | - | - | - |  |
| Australia | 100.0 | 100.0 | 100.0 | 100.0 | 100.0 | 100.0 |  |
|  |
| - nil or rounded to zero (including null cells) |
Western Australia and Queensland together accounted for around 76% of Australian Mining GVA in 2005-06. Western Australia has significantly increased its share from 29.6% in 1989-90 to 45.2% in 2005-06 while Queensland increased its share from 21.8% in 1989-90 to 30.8% in 2005-06. Victoria has gradually lost industry share throughout the period, falling from 19.2% in 1989-90 to 5.3% in 2005-06 as a result of falling oil production from the Bass Strait oil fields.
 Print Page
 Print All