COMMUNICATION SERVICES
Definition and scope
The Communication services industry includes all units mainly engaged in providing postal, courier and telecommunication services.
ANZSIC93 Division J, Communication services, consists of one sub-division:
- Communication services (sub-division 71).
This sub-division is made up of two groups:
- Postal and courier services (group 711)
- Telecommunication services (group 712).
Summary of GSP(P) sources and methods
The methodology for Communication services uses an output indicator approach to compile state by industry GVA estimates. Turnover volume measures are estimated using revenue data and price indexes from the ABS CPI. The output volumes then form the basis upon which volume measures of value added are derived at the division level.
For postage services, state revenue data from Australia Post (2000-01 onwards) and private postal and courier turnover data from QBIS (2001-02 onwards) is used. Australia Post revenue has been extrapolated back to 1989-90 based on state population estimates. State private postal and courier revenue has been extrapolated back based on national private postal and courier revenue.
Estimates of public telecommunications services are based on national revenue data for Telstra and has been split to state using population data. State private telecommunication revenue data are available from QBIS for each state back to 2001-02. The state private telecommunication revenue has been backcast based on national private telecommunication revenue.
The output indicators are price deflated to produce state turnover volume measures. Australia Post and private postal and courier current price turnover are both deflated using the ABS CPI postal services data for the eight capital cities. The Telstra and private telecommunication turnover are deflated using the ABS CPI telecommunication services data for the eight capital cities.
These state turnover volume measures are aggregated and used to produce volume measures of GVA for state Communication services. The state volume GVAs are benchmarked to the annual national industry volume GVA.
Results for Communication services
Communication services gross value added(a), Chain volume measures(b) |
|  |
 | 2000-01 | 2001-02 | 2002-03 | 2003-04 | 2004-05 | 2005-06 |  |
Values ($m) |  |
|  |
| New South Wales | 6 821 | 6 931 | 7 310 | 7 574 | 7 791 | 8 389 |  |
| Victoria | 5 765 | 5 911 | 6 560 | 6 984 | 7 119 | 7 548 |  |
| Queensland | 3 141 | 3 284 | 3 574 | 3 734 | 3 826 | 4 146 |  |
| South Australia | 1 147 | 1 191 | 1 271 | 1 334 | 1 372 | 1 484 |  |
| Western Australia | 1 822 | 1 929 | 2 137 | 2 272 | 2 333 | 2 521 |  |
| Tasmania | 321 | 336 | 365 | 388 | 393 | 421 |  |
| Northern Territory | 213 | 224 | 244 | 256 | 260 | 274 |  |
| Australian Capital Territory | 407 | 427 | 454 | 482 | 494 | 549 |  |
| Australia | 19 637 | 20 230 | 21 915 | 23 022 | 23 588 | 25 331 |  |
Percentage changes from previous year (%) |  |
|  |
| New South Wales | 1.6 | 1.6 | 5.5 | 3.6 | 2.9 | 7.7 |  |
| Victoria | 0.3 | 2.5 | 11.0 | 6.5 | 1.9 | 6.0 |  |
| Queensland | 0.4 | 4.5 | 8.8 | 4.5 | 2.5 | 8.4 |  |
| South Australia | 0.4 | 3.8 | 6.7 | 4.9 | 2.9 | 8.1 |  |
| Western Australia | 1.1 | 5.9 | 10.8 | 6.3 | 2.7 | 8.1 |  |
| Tasmania | -1.3 | 4.5 | 8.7 | 6.3 | 1.2 | 7.3 |  |
| Northern Territory | 0.5 | 5.1 | 8.7 | 5.0 | 1.8 | 5.3 |  |
| Australian Capital Territory | 0.6 | 4.9 | 6.3 | 6.3 | 2.5 | 11.0 |  |
| Australia | 0.8 | 3.0 | 8.3 | 5.1 | 2.5 | 7.4 |  |
|  |
| (a) At basic prices. |
| (b) Reference year for chain volume measures is 2004-05. |
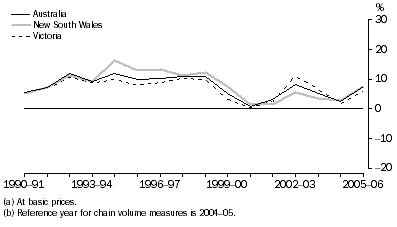
Communication services gross value added(a), Chain volume measures(b)-Percentage changes

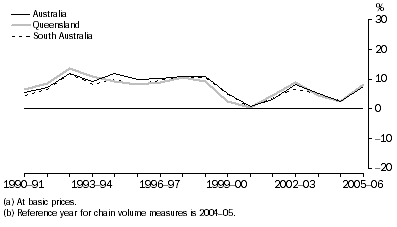
Communication services gross value added(a), Chain volume measures(b)-Percentage changes

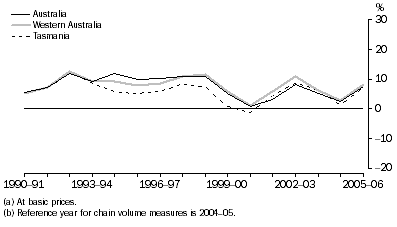
Communication services gross value added(a), Chain volume measures(b)-Percentage changes

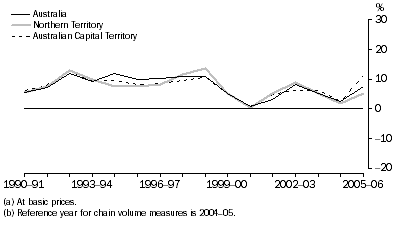
Communication services gross value added(a), Chain volume measures(b)-Percentage changes

New South Wales, Tasmania and the Northern Territory diverged slightly from the Australian growth pattern during the 1990s. From 2001-02, all states increased their growth, with quite large growth in 2002-03, especially in Victoria (11.0%) and Western Australia (10.8%). In 2005-06, all states experienced high growth ranging from 5.3% in the Northern Territory to 11.0% in the Australian Capital Territory.
Communication services gross value added, State shares - Current prices |
|  |
 | 1989-90 | 1994-95 | 1999-00 | 2003-04 | 2004-05 | 2005-06 |  |
 | % | % | % | % | % | % |  |
|  |
| New South Wales | 37.1 | 33.9 | 34.8 | 33.4 | 33.0 | 33.0 |  |
| Victoria | 27.3 | 28.5 | 28.1 | 29.6 | 30.2 | 30.3 |  |
| Queensland | 15.2 | 16.5 | 16.4 | 16.4 | 16.2 | 16.1 |  |
| South Australia | 7.1 | 6.3 | 6.0 | 6.0 | 5.8 | 6.0 |  |
| Western Australia | 9.1 | 9.9 | 10.0 | 10.0 | 9.9 | 9.8 |  |
| Tasmania | 1.8 | 1.7 | 1.7 | 1.6 | 1.7 | 1.6 |  |
| Northern Territory | 0.9 | 1.1 | 1.2 | 1.1 | 1.1 | 1.1 |  |
| Australian Capital Territory | 1.6 | 2.1 | 1.8 | 2.0 | 2.1 | 2.0 |  |
| Australia | 100.0 | 100.0 | 100.0 | 100.0 | 100.0 | 100.0 |  |
|  |
New South Wales and Victoria together accounted for over 63% of Australian Communication services GVA in 2005-06. New South Wales, South Australia and Tasmania have decreased their shares over the time series, with New South Wales declining from 37.1% in 1989-90 to 33.0% in 2005-06. Victoria, Queensland, Western Australia and the Australian Capital Territory all increased their share. Victoria increased its share from 27.3% in 1989-90 to 30.3% in 2005-06.
 Print Page
 Print All