CAPITAL INPUTS
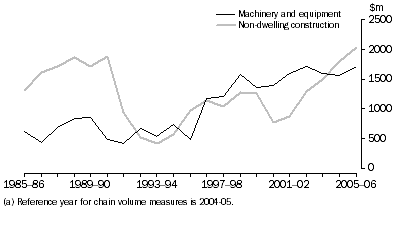
An analysis of tourist accommodation data shows that there was significant growth in the stock of available tourist accommodation (measured in available bed nights) from 1985-86 to 1991-92, which aligns with the significant growth of gross fixed capital formation (GFCF) in non-dwelling construction during this period (figure 10.3). The data show growth in available accommodation between 5 and 10% per year between 1985-86 and 1991-92. During the same period average room occupancy rates declined from approximately 70% in 1985-86 to 50% in 1991-92 (ABS 2006d). After 1991-92 there was very little growth in the stock of available tourist accommodation until 1994-95, which aligns with the significant decline in GFCF during this period. Occupancy rates increased from 1991-92 to 1994-95, indicating that spare capacity was beginning to be utilised.
The rapid decline in productivity from 1985-86 to 1991-92 may be related to the drop in occupancy rates. The level of output in this industry was still growing at a steady rate during this period but it was being exceeded by growth in investment and employment, associated with the significant increase in available accommodation.
In this industry, leased and rented capital in the form of non-dwelling construction represents a significant proportion of intermediate inputs. It is likely the bulk of cafes and restaurants along with a significant proportion of pubs and clubs lease rather than own their property. Any change in this proportion would have an impact on capital inputs in this industry, and thus affect value added based productivity estimates.
10.3 ACCOMODATION, CAFES & RESTAURANTS GROSS FIXED CAPITAL FORMATION, Chain volume measure (a)

There has been a significant increase in gross fixed capital formation for both machinery and equipment and non-dwelling construction since the mid 1990s (figure 10.3). This followed a period of very low investment during the early 1990s.
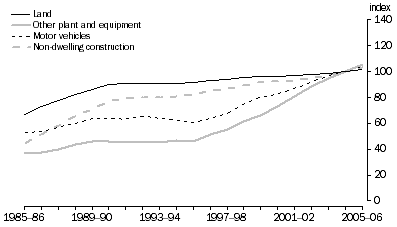
There was a significant increase in the productive capital stock of land and non-dwelling construction during the late 1980s (figure 10.4). The very high growth in machinery and equipment gross fixed capital formation after 1995-96 is also clear. The majority of machinery and equipment in this industry consists of motor vehicles and other plant and equipment.
10.4 ACCOMMODATION, CAFES & RESTAURANTS, PRODUCTIVE CAPITAL STOCK BY ASSET, (2004-05 = 100)

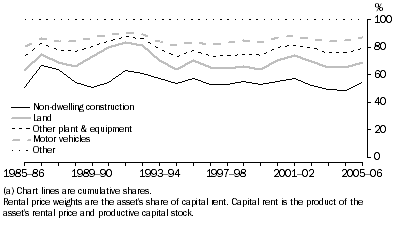
An analysis of the rental price weights since 1985-86 shows that non-dwelling construction contributes the bulk of capital in this industry (figure 10.5). The stock of land and investment in non-dwelling construction increased during the late 1980s and early 1990s, with the demand for land likely to be closely linked to non-dwelling construction. The rental price weights have remained relatively stable since 1994-95.
10.5 ACCOMMODATION, CAFES & RESTAURANTS RENTAL PRICE WEIGHTS (a)

 Print Page
 Print All