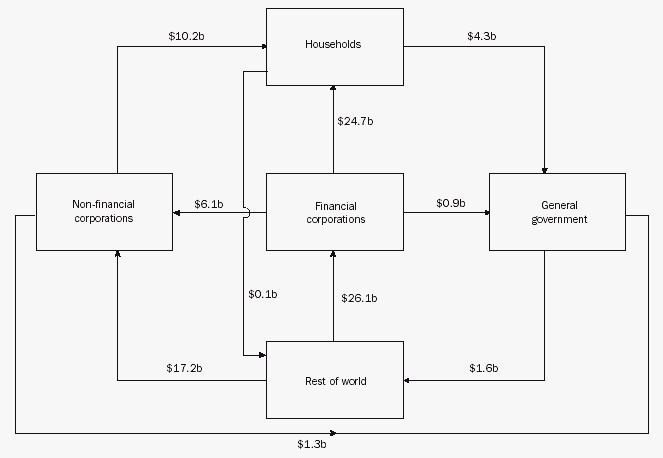
The data collected by APRA are combined with data from other sources by the Australian Bureau of Statistics (ABS) to compile a set of financial accounts according to the international standard, the System of National Accounts 1993 (SNA93). Diagram 26.1 provides an overview of the flows of capital through the financial system and summarises the end result of applying the current statistical framework. It illustrates the net financial flows between sectors during the year 2002-03. The arrows show the net flow from lenders to borrowers. For example, there is a $24.7b net flow from the financial corporations sector to households. There is also an $6.1b net flow from financial corporations to non-financial corporations. This is mainly attributable to increased loans by financial intermediaries and increased share purchases by financial institutions such as life offices and pension funds.
26.1 INTER-SECTORAL FINANCIAL FLOWS - 2002-03

Note: The arrows show the direction of net financial flows from lending sectors to borrowing sectors. The number relating to each arrow indicates the value of that net flow during the period. Other claims are omitted from the diagram. For this reason, inter-sectoral borrowing does not equal inter-sectoral lending.
Source: Australian National Accounts: Financial Accounts, June 2003 (5232.0).