|
|
The ABS has published projections of the Australian population to the year 2101, based on a combination of assumptions concerning future levels of births, deaths and migration. Three main population projection series (Series A, B and C) have been published, based on differing levels of these variables.
Series A assumes a total fertility rate (TFR) of 1.8 babies per woman from 2010-11, remaining constant at this level through to 2050-51; life expectancy at birth of 92.3 years for males and 95.0 years for females from 2050-51; net overseas migration (NOM) of 125,000 per year from 2005-06 through to 2050-51; and high levels of interstate migration. Series B assumes a TFR of 1.6 from 2010-11, remaining constant at this level through to 2050-51; life expectancy at birth of 84.2 years for males and 87.7 years for females by 2050-51; NOM of 100,000 per year from 2005-06 through to 2050-51; and medium flows of interstate migration. Series C assumes a TFR of 1.4 by 2010-11, remaining constant at this level through to 2050-51; life expectancy at birth of 84.2 years for males and 87.7 years for females by 2050-51; NOM of 70,000 per year from 2005-06 through to 2050-51; and small flows of interstate migration. In all these series, the assumptions to 2050-51 will remain constant to 2100-01. Unless otherwise stated, this analysis uses both Series A and C to show a range, although not the full range, of the projected populations. At times, to simplify the analysis, only the medium series, Series B, has been chosen.
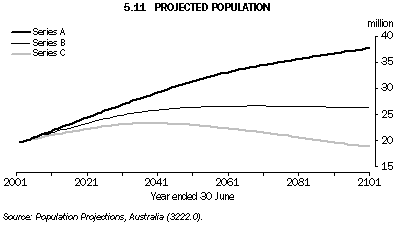
Australia’s population at 30 June 2002 of 19.7 million is projected to grow to between 23.0 and 31.4 million in 2050-51, and between 18.9 and 37.7 million in 2100-01. Under Series A (high series), the population will continue to grow throughout the projection period, but at declining rates, reaching 31.4 million in 2050-51 and 37.7 million in 2100-01. Under Series B (medium series), the population will reach 26.4 million in 2100-01, after peaking at 26.7 million in 2068-69 and then declining gradually. Series C (low series) projects the lowest population for 2100-01 of 18.9 million people. Under this scenario, the population will peak in 2038-39 at 23.3 million and then decline at a slightly faster rate than under Series B (graph 5.11).
The growth rate of the population reflects the interaction of the components of population change: natural increase (the excess of births over deaths) and net overseas migration. Throughout the 1990s and early-2000s, Australia's annual population growth rate has consistently exceeded 1%. While growth rates of this magnitude are projected to continue for the next 4-15 years (except under Series C), growth will slow for the remainder of the projection period. Series A maintains positive growth throughout the projection period, although the growth rate declines over time from 1.29% in the first projected year to 0.26% each year in the last five years. This growth is sustained by a relatively high level of fertility combined with high net overseas migration. Under Series B and C, by contrast, the population would experience a more rapid decline in growth. Series B projects negative growth from 2068-69 while Series C projects negative growth from 2038-39. Series B projects an almost constant population size over the middle years of the projection period. The higher negative growth rates experienced under Series C reflect the fact that net overseas migration is not sufficient to offset the effect of declining number of births combined with an increasing number of deaths.

5.12 ACTUAL AND PROJECTED POPULATION - 30 June
|
 | 2002 | 2021 |  | 2051 |
 |
|
|  |
|
 | Actual | Series A | Series B | Series C |  | Series A | Series B | Series C |
| Capital city/balance of state | ’000 | ’000 | ’000 | ’000 |  | ’000 | ’000 | ’000 |
|
| Sydney | 4,170.9 | 5,108.2 | 4,910.8 | 4,678.0 |  | 6,587.6 | 5,652.5 | 4,913.9 |
| Balance of New South Wales | 2,469.4 | 2,760.5 | 2,727.0 | 2,695.0 |  | 3,005.6 | 2,703.1 | 2,570.0 |
| New South Wales | 6,640.4 | 7,868.7 | 7,637.8 | 7,373.0 |  | 9,593.2 | 8,355.6 | 7,484.0 |
| Melbourne | 3,524.1 | 4,348.1 | 4,188.9 | 4,061.1 |  | 5,561.7 | 4,792.8 | 4,369.1 |
| Balance of Victoria | 1,348.4 | 1,434.4 | 1,465.9 | 1,498.8 |  | 1,410.0 | 1,407.1 | 1,475.7 |
| Victoria | 4,872.5 | 5,782.5 | 5,654.8 | 5,560.0 |  | 6,971.7 | 6,199.9 | 5,844.8 |
| Brisbane | 1,689.1 | 2,481.1 | 2,288.0 | 2,113.0 |  | 3,776.9 | 3,018.5 | 2,483.1 |
| Balance of Queensland | 2,018.1 | 2,935.0 | 2,705.1 | 2,461.2 |  | 4,317.0 | 3,411.2 | 2,689.6 |
| Queensland | 3,707.2 | 5,416.1 | 4,993.0 | 4,574.2 |  | 8,093.9 | 6,429.7 | 5,172.6 |
| Adelaide | 1,114.3 | 1,190.7 | 1,181.2 | 1,173.3 |  | 1,241.7 | 1,134.6 | 1,098.3 |
| Balance of South Australia | 406.0 | 412.1 | 410.9 | 410.4 |  | 373.8 | 341.0 | 333.9 |
| South Australia | 1,520.2 | 1,602.8 | 1,592.0 | 1,583.7 |  | 1,615.5 | 1,475.6 | 1,432.2 |
| Perth | 1,413.7 | 1,931.7 | 1,804.9 | 1,663.6 |  | 2,752.2 | 2,235.2 | 1,808.5 |
| Balance of Western Australia | 513.7 | 648.3 | 603.0 | 537.8 |  | 821.7 | 639.3 | 450.7 |
| Western Australia | 1,927.3 | 2,580.0 | 2,407.9 | 2,201.5 |  | 3,573.9 | 2,874.5 | 2,259.3 |
| Hobart | 198.0 | 220.6 | 203.2 | 189.8 |  | 240.1 | 175.7 | 148.1 |
| Balance of Tasmania | 274.7 | 299.8 | 271.4 | 248.2 |  | 312.1 | 210.8 | 159.5 |
| Tasmania | 472.7 | 520.3 | 474.6 | 438.0 |  | 552.2 | 386.5 | 307.6 |
| Darwin | 107.4 | 157.3 | 141.3 | 116.4 |  | 257.1 | 199.3 | 121.5 |
| Balance of Northern Territory | 90.6 | 123.4 | 99.1 | 84.8 |  | 197.2 | 107.8 | 62.7 |
| Northern Territory | 198.0 | 280.7 | 240.4 | 201.2 |  | 454.3 | 307.1 | 184.1 |
| Australian Capital Territory | 321.8 | 407.1 | 364.9 | 332.7 |  | 538.0 | 389.6 | 296.8 |
| Total capital cities | 12,538.9 | 15,844.8 | 15,083.2 | 14,327.9 |  | 20,955.3 | 17,598.2 | 15,239.3 |
| Total balance of states and territories(a)(b) | 7,121.3 | 8,613.5 | 8,282.4 | 7,936.2 |  | 10,437.4 | 8,820.3 | 7,742.1 |
| Australia(b) | 19,662.8 | 24,461.1 | 23,368.4 | 22,267.1 |  | 31,396.1 | 26,421.5 | 22,984.2 |
|
(a) Excludes Balance of ACT.
(b) Includes Other Territories. |
 |  |  |  |  |  |  |  |  |
| Source: Population Projections, Australia (3222.0). |
The projections show that the ageing of the population, which is already evident, will continue. This is the inevitable result of fertility remaining at low levels over a long period while mortality rates decline. The median age at 30 June 2002 of 35.9 years will increase to between 40.4 and 42.3 years in 2021 and between 46.0 and 49.9 years in 2051.
The ageing of the population affects the entire age structure of the population. The proportion of the population aged under 15 years will fall from 20% (4.0 million) of the population at 30 June 2002, to between 12% and 15% (2.8 million to 4.8 million) in 2051. This proportion will remain within 12% and 15% in 2101 (growing to between 3.6 million to 5.5 million). The proportion of the population aged 50 years and over will increase from 29% (5.7 million) at 30 June 2002 to between 46% and 50% (11.5 million to 14.3 million) in 2051 and 47% and 51% (9.6 million to 18 million) in 2101.
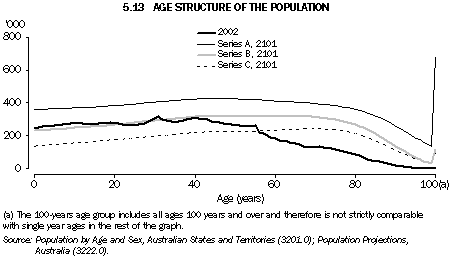
Consequently, the age structure of the population will change noticeably by 2101. Graph 5.13 shows a heavier concentration in the ages 50 years and over and smaller increases or slight declines in the younger ages.

5.14 POPULATION, Summary indicators
|
 |  | Units | 1901 | 1947 | 1971 | 2002 | 2021(a) | 2051(a) | 2101(a) |
|
| Total population | '000 | 3,773.8 | 7,579.4 | 13,067.3 | 19,662.8 | 23,368.4 | 26,421.5 | 26,355.7 |
| Proportion of population aged (years) |  |  |  |  |  |  |  |  |
 | 0-14 | % | 35.1 | 25.1 | 28.7 | 20.3 | 16.1 | 14.0 | 13.8 |
 | 15-64 | % | 60.8 | 66.8 | 63.0 | 67.1 | 64.9 | 58.9 | 57.2 |
 | 65-84 | % | 3.9 | 7.7 | 7.8 | 11.2 | 16.5 | 21.1 | 22.0 |
 | 85 and over | % | 0.1 | 0.4 | 0.5 | 1.4 | 2.5 | 6.0 | 6.9 |
| Males per 100 females | no. | 110.1 | 100.4 | 101.1 | 98.4 | 98.7 | 98.7 | 99.4 |
| Median age | years | 22.5 | 30.7 | 27.5 | 35.9 | 41.2 | 46.8 | 47.5 |
| Proportion living in capital cities | % | 36.8 | 51.2 | 63.2 | 63.9 | 64.5 | 66.6 | n.a. |
|
| (a) Series B population projections. |
 |  |  |  |  |  |  |  |  |  |
| Source: Australian Demographic Statistics (3101.0); Australian Demography, 1947; Population Projections, Australia (3222.0). |
|
 Print Page