LABOUR MARKET SUMMARY
APRIL 2011
Summary of Australia's key labour market indicators.
Key Measures |
|
 |  |  |  | % Change from |
 |  | Period | Current figure | Previous qtr(a) | Previous year(b) |
Trend |
|
| Employed |  |  |  |  |
 | Persons ('000) | Feb 11 | 11 433.7 | 0.4 | 2.9 |
 | Full-time ('000) | Feb 11 | 8 055.0 | 0.5 | 3.6 |
 | Part-time ('000) | Feb 11 | 3 378.7 | 0.0 | 1.3 |
 | Part-time employment as a proportion of total employment (%) | Feb 11 | 29.6 | (c)-0.1 | (c)-0.5 |
| Employment to population ratio |  |  |  |  |
 | Persons (%) | Feb 11 | 62.5 | (c)0.1 | (c)0.7 |
 | Males (%) | Feb 11 | 69.3 | (c)0.1 | (c)0.9 |
 | Females (%) | Feb 11 | 55.9 | (c)0.0 | (c)0.5 |
| Unemployed |  |  |  |  |
 | Persons ('000) | Feb 11 | 604.1 | -2.3 | -3.8 |
 | Looking for full-time work ('000) | Feb 11 | 424.3 | -2.2 | -6.7 |
 | Looking for part-time work ('000) | Feb 11 | 179.8 | -2.5 | 3.7 |
 | Unemployment rate - persons (%) | Feb 11 | 5.0 | (c)-0.1 | (c)-0.3 |
| Long-term unemployment |  |  |  |  |
 | Persons ('000) | Feb 11 | 113.9 | -4.2 | 2.3 |
 | As a proportion of total unemployment (%) | Feb 11 | 18.9 | (c)-0.4 | (c)1.1 |
 | Long-term unemployment rate (%) | Feb 11 | 0.9 | (c)0.0 | (c)0.0 |
| Labour underutilisation rates |  |  |  |  |
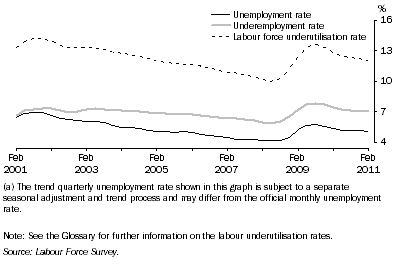
 | Underemployment rate (%) | Feb 11 | 7.0 | (c)-0.1 | (c)-0.4 |
 | Labour force underutilisation rate (%) | Feb 11 | 12.1 | (c)-0.1 | (c)-0.8 |
| Labour force participation rate |  |  |  |  |
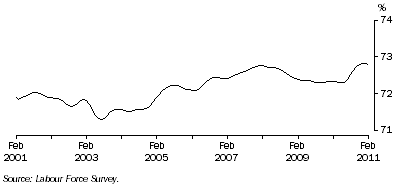
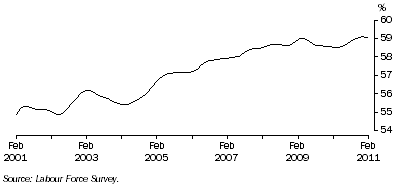
 | Persons (%) | Feb 11 | 65.8 | (c)0.0 | (c)0.5 |
 | Persons aged 15-64 years (%) | Feb 11 | 76.9 | (c)0.0 | (c)0.6 |
| Aggregate monthly hours worked |  |  |  |  |
 | Persons (mill. hours) | Feb 11 | 1 599.8 | 0.1 | 2.6 |
| Wage price index |  |  |  |  |
 | Total hourly rates of pay excluding bonuses (index) | Dec 10 | 106.5 | 0.9 | 3.8 |
| Average weekly earnings |  |  |  |  |
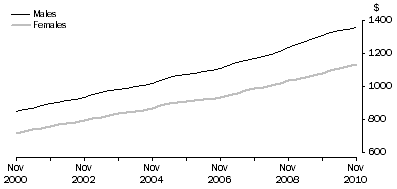
 | Full-time adult ordinary time earnings ($) | Nov 10 | 1 272.5 | 0.8 | 3.9 |
 | All employees total earnings ($) | Nov 10 | 992.5 | 0.8 | 3.9 |
| Job vacancies - Australia ('000) | Feb 11 | 195.0 | 3.6 | 20.8 |
Original |
|
| Average actual weekly hours worked |  |  |  |  |
 | Persons (hours) | Feb 11 | 34.2 | 1.0 | -0.4 |
 | Full-time (hours) | Feb 11 | 41.2 | 0.6 | -1.0 |
 | Part-time (hours) | Feb 11 | 17.0 | 1.3 | -0.6 |
| Proportion of part-time workers who preferred to work more hours (%) | Feb 11 | 25.8 | (c)0.3 | (c)-1.7 |
| Industrial disputes |  |  |  |  |
 | Working days lost ('000) | Dec qtr 10 | 27.2 | -41.6 | -39.1 |
 | Working days lost per 1,000 employees (no.) | Dec qtr 10 | 2.7 | -43.0 | -42.0 |
| Labour force status of families |  |  |  |  |
 | Children living without an employed parent (%)(d) | Jun 10 | 13.9 | na | (c)-1.1 |
|
| na not available |
| (a) Same period previous quarter (monthly data is presented for the middle month of each quarter). |
| (b) Same period previous year. |
| (c) Change is in percentage points. |
| (d) As a proportion of all children aged under 15 years. |
EMPLOYMENT: TREND SERIES
Full-time and total employment

Males and females

PART-TIME EMPLOYMENT: TREND SERIES
Proportion of total employment, Males

Proportion of total employment, Females

UNEMPLOYMENT RATE: TREND SERIES
Males and females

LONG-TERM UNEMPLOYMENT: TREND SERIES
Proportion of total unemployment

UNDERUTILISED LABOUR: TREND SERIES
labour force underutilisation rates
PARTICIPATION RATE: TREND SERIES
Persons

Males
Females
WAGE PRICE INDEX: TREND SERIES
total hourly rates of pay excluding bonuses, Quarterly change

AVERAGE WEEKLY EARNINGS: TREND SERIES
full time adult ordinary time earnings
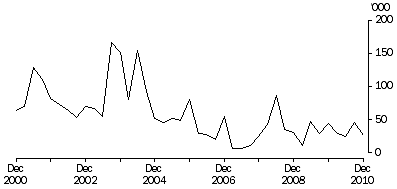
INDUSTRIAL DISPUTES: ORIGINAL SERIES
Working days lost, Quarter Ending
 Print Page
 Print All