INTERNATIONAL MIGRATION
Each year Australia's population increases as a result of net overseas migration and natural increase (the number of births minus the number of deaths). Net Overseas Migration (NOM) is the net gain or loss of population through immigration to Australia and emigration from Australia. It is based on an international travellers' duration of stay being in or out of Australia for 12 months or more. In 2007-08, there were 442,100 arrivals that contributed to NOM and 228,400 departures, providing a net gain of 213,700 people (Table 7.27).
Since 2006-07, Australia has employed an improved method of estimating NOM where a traveller can be added to or subtracted from Australia's population through NOM if the traveller has stayed in or been absent from Australia for a period of 12 months or more over a 16 month period. The implementation of this method has resulted in a break in time series with earlier NOM estimates based on a 12 out of 12 months rule.
7.27 Net Overseas Migration Components |
|
 | 2000-01 | 2002-03 | 2004-05 | 2006-07 | 2007-08(a) |
 | '000 | '000 | '000 | '000 | '000 |
|
| NOM Arrivals | 348.6 | 392.9 | 431.1 | 437.5 | 442.1 |
| NOM Departures | 212.9 | 276.4 | 307.3 | 204.7 | 228.4 |
| NOM(b) | 135.7 | 116.5 | 123.8 | 232.8 | 213.7 |
|
| (a) Estimates for 2007-08 are preliminary. |
| (b) Estimates for NOM contain a break in time series. Estimates from 2006-07 use an improved methodology based on the 12/16 rule, all years prior to this use the 12/12 rule. |
| Source: ABS Migration, Australia (3412.0). |
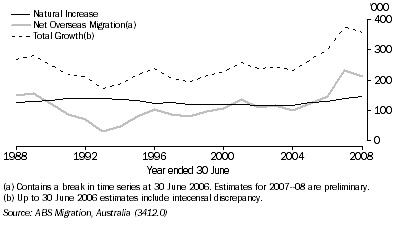
Until recently, Australia's population growth has predominantly come from natural increase. However, since 1998-99, NOM comprised 45% or more of Australia's population growth, with 2003-04 being the exception (43%). In 2007-08, a NOM estimate of 213,700 people represented 59% of Australia's population growth for the year. The peaks and troughs in Australia's total population growth are clearly driven by NOM as shown in graph 7.28.
7.28 Growth and COMPONENTS OF POPULATION change, Australia

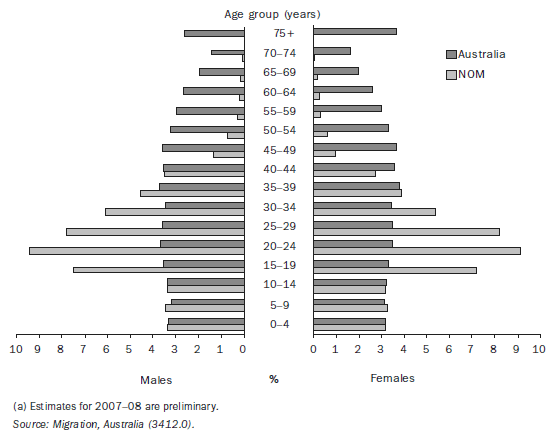
The main effect of NOM on the age structure of Australia's population is that it results in a larger proportion of persons of early working age (14-34 years). In 2007-08, persons aged 15-34 years comprised 61% of NOM compared with 28% of Australia's total population. Persons aged 0-14 years comprised 20% of NOM and 19% of Australia's population, and persons aged 65 years and over comprised 0.5% of NOM and 13% of Australia's population (graph 7.29).
7.29 Australian and Net Overseas Migration Population Structures, Age and sex-2007-08(a)

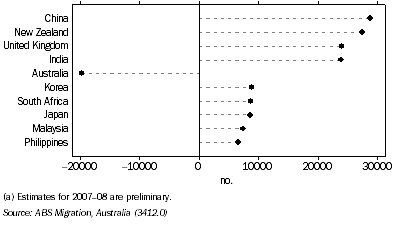
During 2007-08, travellers who contributed to NOM were born in over 200 countries. Migrants born in China were the highest contributors to Australia's population with a positive NOM of 28,700 persons. This was followed closely by migrants born in New Zealand (27,400), the United Kingdom (24,000) and India (23,900). Historically, the United Kingdom and New Zealand have ranked as the major source countries. However, in 2005-06 China moved into the top position.
In 2007-08, of the top 10 countries of birth contributing to NOM, only those who were born in Australia had more departures than arrivals, with 19,800 persons being subtracted from Australia's population (as seen in graph 7.30).
7.30 NET OVERSEAS MIGRATION, Top 10 Countries of Birth
: Australia
- 2007-08(a)

The United Nations'
World Population Prospects: The 2008 Revision, presents international migration statistics averaged over five years to improve comparability between countries. As with Australia, countries such as Canada, the United States of America and United Kingdom experienced high net international migration rates in 2005-10 (rates above 3.0 per 1,000 population). In numeric terms, in the 2005-10 period, for selected countries, the gains from net international migration ranged from an average 10,000 persons per year for New Zealand to one million persons for the United States of America. The losses ranged from 6,000 persons for the Republic of (South) Korea to 346,000 persons for China (table 7.31).
7.31 NET INTERNATIONAL MIGRATION(a), Selected countries |
|
 | 2000-05 | 2005-2010 | Percentage change,
2000-05 to 2005-10 |
 |
|  |
|  |
 | Number | Migration rate(b) |  | Number | Migration rate(b) |  |
 | '000 | rate |  | '000 | rate | % |
|
| Australia | 128 | 6.5 |  | 100 | 4.8 | -21.9 |
| Canada | 218 | 6.9 |  | 210 | 6.3 | -3.7 |
| China | -412 | -0.3 |  | -346 | -0.3 | -16.0 |
| India | -308 | -0.3 |  | -200 | -0.2 | -35.1 |
| Japan | 16 | 0.1 |  | 30 | 0.2 | 87.5 |
| Korea, Republic of | -13 | -0.3 |  | -6 | -0.1 | -53.8 |
| Malaysia | 30 | 1.2 |  | 26 | 1.0 | -13.3 |
| New Zealand | 21 | 5.1 |  | 10 | 2.4 | -52.4 |
| South Africa | 140 | 3.0 |  | 140 | 2.8 | - |
| United Kingdom | 190 | 3.2 |  | 190 | 3.1 | - |
| United States of America | 1 135 | 3.8 |  | 1 010 | 3.3 | -11.0 |
|
| - nil or rounded to zero (including null cells) |
| (a) Medium variant. |
| (b) Net overseas migration per 1,000 population. |
| Source: United Nations Population Division, World Population Prospects: The 2008 Revision. Accessed 17 Sep 2009. |
 Print Page