BUSINESS AND INDUSTRY
COUNTS OF BUSINESSES
The Australian Bureau of Statistics uses an economic statistics units model on the Australian Bureau of Statistics Business Register (ABSBR) to describe the characteristics of businesses, and the structural relationships between related businesses.
Within large and diverse business groups, the units model is also used to define reporting units that can provide data to the ABS at suitable levels of detail. The units model can be used to produce counts of businesses from the ABSBR.
11.1 COUNTS OF BUSINESSES BY INDUSTRY, ACT - June 2004 |
|  |
 | Employment size range |  |  |  |  |
 | 0-19 | 20-199 | 200+ | Total employing | Non-employing | Total |  |
| Industry | no. | no. | no. | no. | no. | no. |  |
|  |
| Agriculture, forestry and fishing | 125 | 10 | np | 135 | 694 | 829 |  |
| Mining | np | - | - | np | np | 41 |  |
| Manufacturing | 356 | np | np | 408 | 939 | 1 347 |  |
| Electricity, gas and water supply | np | np | np | np | np | 34 |  |
| Construction | 1 313 | np | np | 1 376 | 5 993 | 7 369 |  |
| Wholesale trade | 273 | np | np | 313 | 447 | 760 |  |
| Retail trade | 1 365 | np | np | 1 621 | 1 709 | 3 330 |  |
| Accommodation, cafes and restaurants | 459 | 184 | 6 | 649 | 384 | 1 033 |  |
| Transport and storage | 244 | 19 | - | 263 | 1 460 | 1 723 |  |
| Communication services | np | 6 | np | 98 | 328 | 426 |  |
| Finance and insurance | 700 | np | np | 715 | 4 652 | 5 367 |  |
| Property and business services | 3 152 | 255 | 17 | 3 424 | 9 004 | 12 428 |  |
| Education | 107 | 16 | - | 123 | 801 | 924 |  |
| Health and community services | 799 | 82 | 6 | 887 | 1 280 | 2 167 |  |
| Cultural and recreational services | 232 | np | np | 287 | 1 357 | 1 644 |  |
| Personal and other services | 520 | np | np | 574 | 1 310 | 1 884 |  |
| All industries | 9 749 | 1 089 | 50 | 10 888 | 30 418 | 41 306 |  |
|  |
| - nil or rounded to zero (including null cells) |
| np not available for publication but included in totals where applicable, unless otherwise indicated |
| Source: Australian Bureau of Statistics Business Register, Counts of Businesses, Summary Tables, June 2004 (cat. no. 8161.0.55.001). |
At June 2004, there were 41,306 active business in the ACT on the ABSBR. Of these, 10,888 (26%) were employing businesses, and 30,418 (74%) were non-employing businesses. Nationally, there were 3,015,318 active businesses on the ABSBR, of which 28% were employing businesses and 72% were non-employing businesses.
In the ACT, Property and business services had the greatest number of employing businesses (3,424, or 31%), followed by Retail trade (1,621, or 15%) and Construction (1,376, or 13%). For non-employing businesses, the greatest number of businesses were in Property and business services (9,004, or 30%), Construction (5,993, or 20%) and Finance and insurance (4,652, or 15%).
The majority of employing businesses in the ACT (9,749, or 90%) had between 0 and 19 employees. Ten per cent (1,089 businesses) had 20 to 199 employees, and less than 1% (50 businesses) had 200 employees or more.
RETAIL TRADE
The total retail turnover in chain volume measures for the ACT in 2004-05 was $3,714.4m, which was similar to the 2003-04 figure ($3,691.7m). The Food retailing sector contributed the largest amount to the total turnover with $1,479.4m (40% of total turnover). This was followed by Household good retailing ($710.7m, or 19%) and Hospitality and service industries ($471.6m, or 13%).
The sector with the largest increase between 2003-04 and 2004-05, was Food retailing, up $59.4m. This increase was more than twice the amount of the second highest growth sector, Household good retailing, up $28.1m. The two sectors to record the largest falls over the same period were Hospitality and service industries down $56.1m, and Other retailing down $19.7m.
Over the last six years, since 1999-2000, the largest increase was recorded in the Household good retailing sector, up $407m. This was followed by the Food retailing sector, up $371.8m. The only decrease recorded in this period was in the Recreational good retailing sector, down $25.6m.
11.2 RETAIL TURNOVER, Chain volume measures ($m) - ACT |
|  |
 | 1999-2000 | 2000-01 | 2001-02 | 2002-03 | 2003-04 | 2004-05 |  |
|  |
| Food retailing | 1 174.0 | 1 301.3 | 1 428.8 | 1 412.9 | 1 420.0 | 1 479.4 |  |
| Department stores | 332.2 | 317.5 | 331.1 | 344.0 | 350.7 | 346.3 |  |
| Clothing and soft good retailing | 161.9 | 176.1 | 206.9 | 207.4 | 212.5 | 230.4 |  |
| Household good retailing | 415.3 | 412.0 | 490.6 | 577.7 | 682.6 | 710.7 |  |
| Recreational good retailing | 238.3 | 209.5 | 172.1 | 184.3 | 181.0 | 178.6 |  |
| Other retailing | 288.9 | 349.6 | 349.9 | 308.4 | 317.2 | 297.5 |  |
| Hospitality and service industries | 416.3 | 489.8 | 523.6 | 567.0 | 527.7 | 471.6 |  |
| Total(a) | 3 020.6 | 3 234.5 | 3 489.2 | 3 595.8 | 3 691.7 | 3 714.4 |  |
|  |
| (a) Generally, chain volume measures are not additive. In order to minimise the impact of this property, the ABS uses the latest base year as the reference year. By adopting this approach, additivity exists for the reference year and the year after, and non-additivity is relatively small for the years immediately preceding the reference year. |
| Source: Data available on request, Retail Business Survey. |
BANKRUPTCIES
Business bankruptcies
A business bankruptcy is where an individual's bankruptcy is directly related to their ownership of a business.
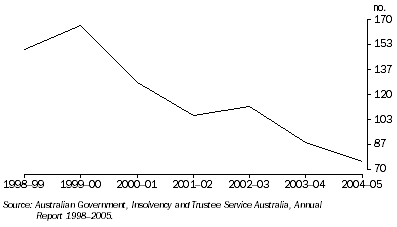
In 2004-05, there were 75 business related bankruptcies in the ACT, a decrease of 15% from 2003-04 (88). This continues the general downward trend of business bankruptcies in the ACT, since the peak of 166 bankruptcies in 1999-2000.
11.3 TOTAL BUSINESS BANKRUPTCIES, ACT

The highest recorded causes of business bankruptcies in the ACT during 2004-05 were personal reasons (including ill health) and excessive drawings, each accounting for 20% of all business bankruptcies. These were followed by economic conditions (18%) and lack of business ability (12%). There were no business bankruptcies attributed to seasonal conditions in 2004-05.
11.4 CAUSES OF BUSINESS BANKRUPTCIES - ACT |
|  |
 | 2002-03 | 2003-04 | 2004-05 |  |
 | no. | % | no. | % | no. | % |  |
|  |
| Economic conditions | 36 | 32 | 25 | 28 | 14 | 18 |  |
| Lack of capital | 12 | 11 | 14 | 16 | 6 | 8 |  |
| Lack of business ability | 3 | 3 | 8 | 9 | 9 | 12 |  |
| Excessive drawings | 11 | 10 | 12 | 14 | 15 | 20 |  |
| Inability to collect debts | 3 | 3 | 1 | 1 | 1 | 1 |  |
| Excessive interest | 5 | 4 | - | - | 2 | 3 |  |
| Failure to keep proper books | 4 | 4 | 4 | 5 | 5 | 7 |  |
| Seasonal conditions | - | - | 1 | 1 | - | - |  |
| Gambling or speculations | 2 | 2 | - | - | 3 | 4 |  |
| Other reasons (incl. not stated) | 7 | 6 | 5 | 6 | 5 | 7 |  |
| Personal reasons (incl. ill health) | 29 | 26 | 18 | 20 | 15 | 20 |  |
| Total | 112 | 100 | 88 | 100 | 75 | 100 |  |
|  |
| - nil or rounded to zero (including null cells) |
| Source: Australian Government, Insolvency and Trustee Service Australia, Annual Report 2002-03, 2003-04, 2004-05. |
Non-business bankruptcies
Non-business bankruptcies refer to bankruptcies where an individual's occupation and cause of bankruptcy are not related to any ownership of a business.
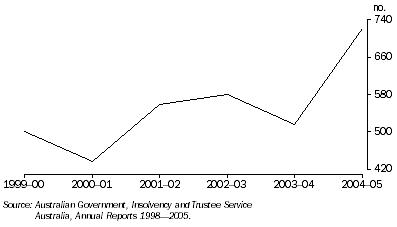
There were 721 non-business bankruptcies in the ACT during 2004-05, an increase of 39% on 2003-04 (517). This was the highest number of non-business bankruptcies recorded over the past 6 years.
11.5 TOTAL NON-BUSINESS BANKRUPTCIES, ACT

The most recorded cause of non-business bankruptcies in the ACT during 2004-05 was unemployment, accounting for 44% (317 bankruptcies) of all non-business bankruptcies. The second highest cause of non-business bankruptcies was excessive use of credit (29%), followed by adverse litigation (10%).
11.6 CAUSES OF NON-BUSINESS BANKRUPTCIES, ACT |
|  |
 | 2002-03 | 2003-04 | 2004-05 |  |
 | no. | % | no. | % | no. | % |  |
|  |
| Unemployment | 272 | 47 | 252 | 49 | 317 | 44 |  |
| Excessive use of credit | 98 | 17 | 101 | 20 | 208 | 29 |  |
| Domestic discord | 104 | 18 | 68 | 13 | 6 | 1 |  |
| Ill health | 47 | 8 | 39 | 8 | 28 | 4 |  |
| Adverse litigation | 28 | 5 | 27 | 5 | 73 | 10 |  |
| Gambling or speculations | 19 | 3 | 13 | 3 | 22 | 3 |  |
| Liabilities on guarantees | 10 | 2 | 14 | 3 | 56 | 8 |  |
| Other causes or not stated | 3 | 1 | 3 | 1 | 11 | 1 |  |
| Total | 581 | 100 | 517 | 100 | 721 | 100 |  |
|  |
| Source: Australian Government, Insolvency and Trustee Service Australia, Annual Report 2002-03, 2003-04, 2004-05. |
INFORMATION TECHNOLOGY
Business use of IT
During 2004-05, 92% of businesses in the ACT used computers, while 84% used the Internet and 28% had a web presence. These were all increases on 2003-04 when 89% of businesses used computers, 78% used the Internet and 21% had a web presence.
At the national level during 2004-05, 89% of businesses used computers, while 77% and 27% used the Internet and had a web presence, respectively.
INNOVATION IN BUSINESS
Innovation has been defined as the process of introducing new or significantly improved goods or services and/or implementing new or significantly improved processes:
- A new good or service means any good or service or combination of these which is new to a business. Its characteristics or intended uses differ significantly from those previously used.
- A new operational process is a significant change for a business in its methods of producing or delivering goods or services.
- A new organisational/managerial process is a significant change to the strategies, structures or routines of the business which aim to improve performance.
Between 2001 and 2003, of the 2,339 businesses surveyed in the ACT, 29% (680 businesses) were innovating. This was comparable with the Northern Territory (28%) and Tasmania (27%). The most popular type of innovation in business in the ACT was new or significantly improved operational processes (22% of innovating businesses).
Drivers of innovation
Drivers relating to innovation were split into two groups: those relating to new goods and services; and those relating to new processes. Each group was further split into three categories: market related drivers; profit related drivers; and legal related drivers. Businesses were able to identify more than one driver.
Drivers relating to new goods and services
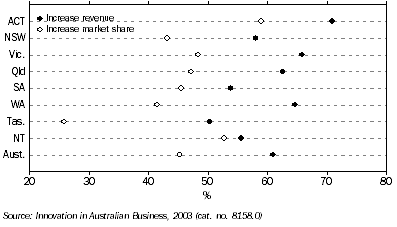
The highest single driver relating to new goods and services in the ACT was in the profit related category, with an increase in revenue driving change for 71% of innovating businesses. This was the highest proportion of all states and territories for this driver. Nationally, the proportion was 61%.
The second highest driver in the ACT was in the market category, with an increase in market share driving 59% of innovating businesses. Again, the ACT recorded the highest proportion of all states and territories for this driver and was also above the national proportion of 45%.
11.7 DRIVERS RELATING TO NEW GOODS AND SERVICES, 2001-03

Increase responsiveness to customer needs was the second highest driver in the market related category, and the third highest driver overall in the ACT (55%). The national proportion was 48%.
Drivers relating to new processes
The biggest driver relating to new processes among innovating ACT businesses was improving productivity (73%), in the profit related category. This was comparable with the leading state (with Queensland recording 75%) while the third highest was Western Australia (62%). Nationally, the proportion was 58%.
Reducing costs was the second highest driver (again, in the profit related category) reported by innovating businesses in the ACT (72%). The only state or territory to record a higher proportion was Tasmania (78%). The national proportion was 58%.
The third highest reported driver relating to new processes was increase responsiveness to customer needs, driving 59% of innovating businesses in the ACT. This was second only to Tasmania (67%) and comparable with Queensland (57%). Nationally, the proportion was 47%.
Sources of ideas and information
Innovating businesses were asked to identify key sources of ideas or information, and which methods were used to acquire knowledge or abilities. Businesses could select more than one source or method.
Ideas from within individual businesses was the highest reported source of ideas or information for innovating ACT businesses (80%), which was the same as the national proportion. The highest proportion of the states and territories for this source was the Northern Territory (91%) and the lowest was New South Wales (75%).
Clients or customers was the second highest reported source of ideas or information for innovating ACT businesses (66%). This was comparable with the national proportion of 65%. Across states and territories, the proportions for this source ranged from 69% for South Australia to 61% for the Northern Territory.
More innovating businesses in the ACT (49%) sourced ideas or information from consultants than any other state or territory. Victoria was second highest (37%) and the national proportion was 32%.
BIBLIOGRAPHY
ABS
ABS Business Register, Counts of Businesses, Summary Tables, June 2004, cat. no. 8161.0.55.001.
Business use of Information Technology, 2004-05, cat. no. 8129.0.
Innovation in Australian Business, 2003 (Re-issue), cat. no. 8158.0.
Retail Business Survey, Data available on request.
NON-ABS
Australian Government, Insolvency and Trustee Service Australia, Annual Reports, 1998-99 to 2004-05, last viewed 10 August 2006,
<http://www.itsa.gov.au/>.
 Print Page
 Print All