|
|
INTRODUCTION
This publication presents regional experimental small business estimates which have been derived using files provided to the Australian Bureau of Statistics (ABS) by the Australian Taxation Office (ATO). The estimates are compiled from completed tax returns for companies, partnerships and trusts, and individuals declaring business income. This issue includes estimates for Australian small business for the 1995-96 to 1999-2000 reference periods. The data are available by industry division at Statistical Division (SD), state and national levels.
For a number of years, the ABS has been expanding the range of data sources it uses in order to decrease the statistical reporting load placed on providers, while continuing to increase the range of information available. A major alternative source of data is the ATO, which collects key economic data for business income tax purposes.
This publication provides estimates for business income data at the regional level. The ABS has released other related publications which provide information on personal income and state level industry estimates. Under taxation law, this data may be passed by the Commissioner for Taxation to the ABS for statistical purposes.
Overview
The statistics in this publication are experimental regional estimates for small business. The purpose of this publication is to alert users to the results of work undertaken by the ABS to increase the range of regional data available. The ATO collects key economic data for business income tax purposes. The estimates in this publication have been derived using ATO data. Under taxation law, these data may be passed by the Commissioner for Taxation to the ABS for statistical purposes.
The estimates in this publication are part of the strategy of the ABS to help meet the need for small area data expressed by various users including the Commonwealth Government, State Governments, regional organisations and local authorities.
This publication provides an overview of selected output at SD level for small business. It is not an attempt to deliver the full range of data available, but has been developed to allow users to examine a potentially rich source of economic data and assess its useability. In addition to this, the ABS will be producing a suite of standard output tables at the SD level and will also provide data tailored to specific needs and regions on a fee for service basis. Refer to the Appendix for a list of the standard tables available.
The Commonwealth Government and some State Government departments have expressed a particular interest in small business economic data over time as an indicator of the flow-on effects of some major economic or policy changes both Australia-wide and in particular regions. Additionally, in some industries, small business represents the vast majority of economic activity and employment and is a very useful indicator of changes in overall activity in a region. The ABS has produced these ‘experimental estimates’ in order to help meet that demand.
The nature of the ATO data does not allow multi-location businesses to be identified and disaggregated. A key assumption is that small businesses are single location. The ABS created the small business definition to enable regional estimates to be produced for a subset of the economy.
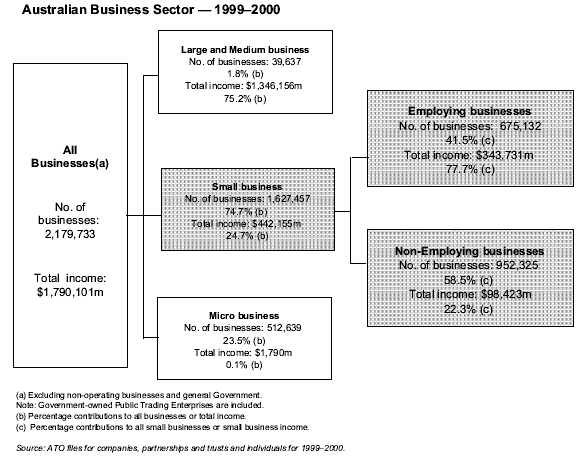
In summary, although the data provide information on the economic activity of small business at a regional level, they do not provide a complete measure of economic activity in a region. They exclude businesses not within the scope of the small business definition, a selection of tax-exempt businesses and some government activity. Whilst the statistics in this publication cover 75% of businesses but only 25% of business income, they are valuable for several reasons. They offer a viable regional time series and the health of large businesses is often reflected in the health of the smaller businesses that deal with them at a local level. Furthermore, the success or failure of small businesses are generally a good indicator of the prevailing economic conditions in a particular region. See the Explanatory Notes for further information.
Methodology
The ATO data for companies, partnerships and trusts, and individuals declaring business income were examined to investigate the quality of regional and industry identifiers. No substantial quality issues were found. Editing was carried out to identify and resolve general errors in the records. Finally, some validation processes were carried out on the resulting datasets in order to further improve the quality of the statistics.
For more detailed information regarding the methodology please refer to Information Paper: Use of Business Income Tax Data for Regional Small Business Statistics - Experimental Estimates, Selected Regions, Australia 1995-96 to 1997-98 (cat. no. 5675.0).
The selected small business definition
For the purposes of this information paper and the experimental estimates provided within it, the definition of small business refers to those businesses whose total income or expenses were between $10,000 and $5m in the financial year.
Once the decision to produce regional data for small business had been taken, a process had to be found to identify these businesses and extract their data from the ATO Business Income Tax File. The ABS considered a number of definitions for small business. From the outset of this process, it was assumed that most small businesses would have only one location.
As the ATO does not require tax-paying legal entities to state whether they have more than one location, it was not possible to use a simple process to identify small business. Research was undertaken into various methods of identifying small business including a number of analytical investigations on the data as well as considering various definitions of small business.
Initially, the ABS considered replicating the 1995 Statistics Canada financial definition completely. Statistics Canada defined small businesses as those with an annual gross operating revenue of between 25,000 and 5 million Canadian dollars (approximately 24,000 to 4.8 million Australian dollars). However, after a wide consultation process with state government departments and other regional organisations, it was decided to adjust the definition for Australian conditions.
A large majority of those consulted found the higher limit acceptable but there was concern about the lower limit. However, there was a need to set a lower limit to exclude businesses which are hobbies generating a small amount of income as these could be operating quite differently from most businesses and could also distort analyses of economic activity. Analyses were carried out, using 1996-97 ATO data, on two lower limits and using income only or both income and expenditure.
A lower limit of around $25,000 was too high, particularly for a regional analysis at industry level. The number of records that would be excluded was significant and the subsequent decline in the proportion of businesses that would be captured was far higher for some ANZSIC divisions than for others. It was felt this would lead to a misrepresentation of the regional industry profile.
It was decided to use the ATO’s lower limit for micro-businesses, which was $10,000. The ATO defines non-commercial business as ‘those non-employing businesses which earn less than $10,000’. These include (i) part-time businesses, (ii) hobbies i.e. wage employees with a small business on the side and (iii) body corporates, i.e. strata titles which can be trading or non-trading.
Rather than defining small business solely from total income cut-offs, a combination of total income and total expenditure cut-offs was preferable when doing time series comparisons as a business could have unusually high or low income or expenditure in one particular year.
When the expense component was added to the definition, and the lower cut-off for both income and expenses was set at $10,000, more entities were captured than when there was no expense component, however, the total increase in the value of data items was significant. For a 32.7% increase in the number of entities, comparatively large increases were achieved in the values of major data items. In some respects, it appeared that this definition negated the trade off between number of entities and values of major data items.
Therefore, small business is defined as those businesses whose total income or expenses were between $10,000 and $5m in the financial year. The ABS has also included data from a subset of small business in the experimental estimates produced in this paper. There was considerable interest amongst users in data on non-employers.
Non-employers are identified by the ABS as businesses which fit the following criteria
(TOTAL WAGE and SALARY EXPENSES = $0 and SUPERANNUATION <= $27,000) and
(TOTAL INCOME > $0 or TOTAL EXPENSES > $0) and
(TOTAL INCOME <= $2m and TOTAL EXPENSES <= $2m)

EXPERIMENTAL ESTIMATES: SMALL BUSINESSES BY SELECTED AREAS, 1995-96 to 1999-2000 |
|
 | 1995-96
| 1998-99
| 1999-2000
| Change 1995-96 to 1999-2000
|
 | Businesses | Income | Businesses | Income | Businesses | Income | Businesses | Income |
 | no. | $m | no. | $m | no. | $m | % | % |
|
| New South Wales | 501988 | 131735 | 519059 | 142,235 | 547016 | 159,294 | 9.0 | 20.9 |
| Sydney SD | 303699 | 90944 | 321802 | 100,559 | 349387 | 115,326 | 15.0 | 26.8 |
| Hunter SD | 34316 | 8334 | 35281 | 8,661 | 36311 | 9,485 | 5.8 | 13.8 |
| Australia | 1505943 | 371,686 | 1551267 | 401,758 | 1627457 | 442,155 | 8.1 | 19.0 |
|
Source: ATO files for companies, partnerships and trusts, and individuals for 1996-96 to 1999-2000
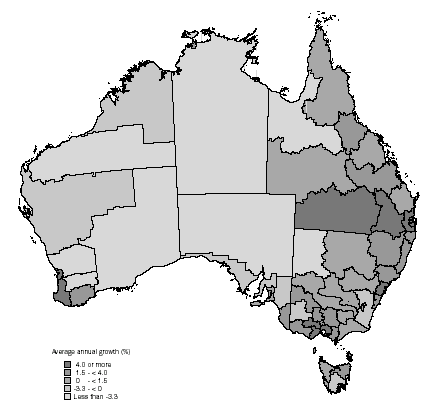
EXPERIMENTAL ESTIMATES: AVERAGE ANNUAL GROWTH IN TOTAL SMALL BUSINESS INCOME BY
STATISTICAL DIVISION, 1995-96 TO 1999-2000  Source: ATO files for companies, partnerships and trusts, and individuals for 1996-96 to 1999-2000
|
 Print Page
 Print All