STAGE OF PRODUCTION COMMENTARY
STAGE OF PRODUCTION (SOP) OVERVIEW
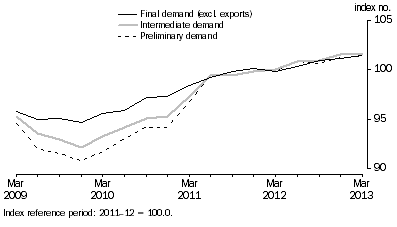
In the March quarter 2013, the Final demand index rose 0.3%, the Intermediate demand index recorded no change and the Preliminary demand index rose 0.2%. Through the year to the March quarter 2013, the Final demand index rose 1.6%, the Intermediate demand index rose 1.5% and the Preliminary demand index rose 1.5%.
The rise of 0.3% in the Final demand index reflected an increase of 0.4% in the prices of domestically produced products and a fall of 0.4% in the prices of imported products. The domestic component recorded rises in the prices received for building construction (+0.8%), other agriculture (+6.5%) and petroleum refining and petroleum fuel manufacturing (+4.1%). Partly offsetting these rises were falls in the prices received for pharmaceutical and medicinal product manufacturing (-3.5%). The imports component recorded falls in the prices for pharmaceutical and medicinal product manufacturing (-6.1%), professional and scientific equipment manufacturing (-3.1%) and specialist machinery and equipment manufacturing (-1.2%). Partly offsetting these falls were rises in the prices for furniture and other manufacturing (+2.8%) petroleum refining and petroleum fuel manufacturing (+4.4%) and cigarette and tobacco product manufacturing (+6.4%).
The Intermediate demand index recorded no change in the March quarter 2013. This reflected no change in the overall price level for domestically produced products and a rise of 0.3% in the prices of imported products. The domestic component recorded rises in the prices received for motor vehicle and motor vehicle part manufacturing (+4.4%) and other agriculture (+3.9%). These were offset by falls in the prices received for printing and printing support services (-4.9%) and petroleum refining and petroleum fuel manufacturing (-2.6%). The imports component recorded rises in the prices for oil and gas extraction (+6.0%) and furniture and other manufacturing (+2.3%). Partly offsetting these rises were falls in the prices for polymer product manufacturing (-1.8%), pharmaceutical and medicinal product manufacturing (-6.2%) and electrical equipment manufacturing (-2.0%).
The rise of 0.2% in the Preliminary demand index reflected an increase of 0.1% in the prices of domestically produced products and a rise of 0.4% in the prices of imported products. The domestic component recorded rises in the prices received for metal ore mining (+7.0%), other agriculture (+4.8%) and oil and gas extraction (+3.2%). Partly offsetting these rises were falls in the prices received for petroleum refining and petroleum fuel manufacturing (-3.1%), coal mining (-2.6%) and sugar and confectionery manufacturing (-9.6%). The imports component recorded rises in the prices for oil and gas extraction (+6.0%) and petroleum refining and petroleum fuel manufacturing (1.5%). Partly offsetting these rises were falls in the prices for metal ore mining (-4.9%), other machinery and equipment manufacturing (-5.7%) and professional and scientific equipment manufacturing (-3.5%).
Comparison of SOP indexes

WHERE TO FIND ADDITIONAL COMMENTARY
Additional commentary for Producer Price Indexes is available in the entry for
Producer Price Indexes, Australia (cat. no. 6427.0) on the ABS website
<https://www.abs.gov.au>.
The additional commentary includes:
- Manufacturing industries producer price indexes
- Input to the Manufacturing industries
- Output of the Manufacturing industries
- Construction industries producer price indexes
- Input to the House construction industry
- Output of the Construction industries
- Services industries producer price indexes
- Output of the Services industries
 Print Page
 Print All