6302.0 - Average Weekly Earnings, Australia, Nov 2012  Quality Declaration
ARCHIVED ISSUE Released at 11:30 AM (CANBERRA TIME) 07/03/2013
Page tools:
 Print Page Print Page
 Print All Print All
| ||
|
INTRODUCTION This article highlights how information from the ABS, in particular the biannual Average Weekly Earnings (AWE) survey, can be used to analyse trends in the salary sacrifice arrangements of Australian employees. BACKGROUND Salary sacrifice is defined as an arrangement where an employee agrees to forgo part of his or her salary in return for benefits of a similar value. Common types of salary sacrifice arrangements include pre-tax contributions to superannuation funds and novated leases for motor vehicles. Currently in Australia, there are different salary sacrifice entitlements for different categories of employees. For example, the Australian Taxation Office (ATO) allows employees of Public Benevolent Institutions (PBI) up to $30,000 in Fringe Benefit Tax (FBT) free benefits over the FBT year. Additionally, in the 2011-12 financial year, employees aged 50 and over were entitled to sacrifice up to $50,000 of their salary to a complying superannuation fund in the financial year (although this was reduced to $25,000 in the 2012-13 financial year). These super contributions are FBT-free and are taxed in the super fund at a maximum rate of 15%, which is generally much lower than if the amounts were subject to Pay As You Go withholding tax. For employees under the age of 50, the concessional contributions cap (i.e. the amount of superannuation that can be salary sacrificed at the lower tax rate and without attracting FBT) was $25,000 for the 2011-12 financial year. The Average Weekly Cash Earnings (AWCE) series, which is inclusive of amounts salary sacrificed, is collected as part of the AWE survey and a historical series dating back to the May 2010 quarter is available. This series is released in addition to, and does not replace, the original AWE series which is exclusive of salary sacrifice. For further information on the background to these changes, refer to Information Paper: Changes to ABS Measures of Employee Remuneration (cat. no. 6313.0). The AWE and AWCE series provide estimates of average weekly earnings and average weekly amounts salary sacrificed. While the series show average amounts for a population (e.g. Total Australia), the series cannot separately provide details on those employees who salary sacrifice. This means, for example, that the amount salary sacrificed by those doing so will be higher than the average amount sacrificed by all employees. Information on salary sacrifice is available from other ABS releases including:
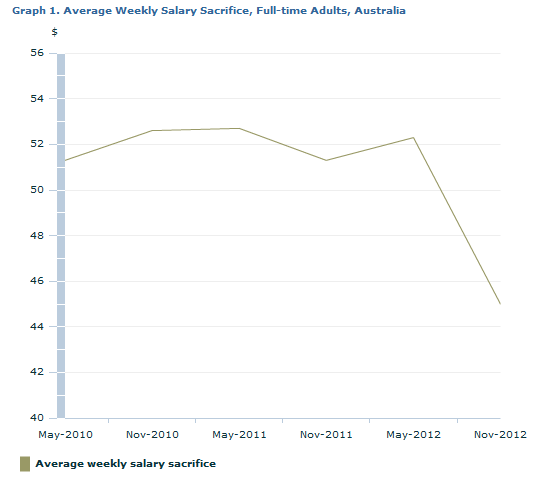
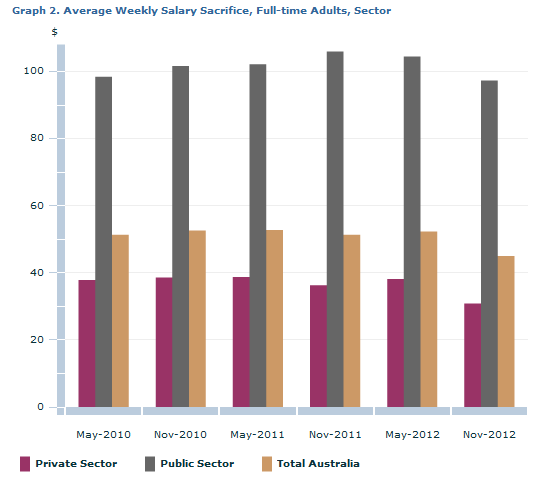
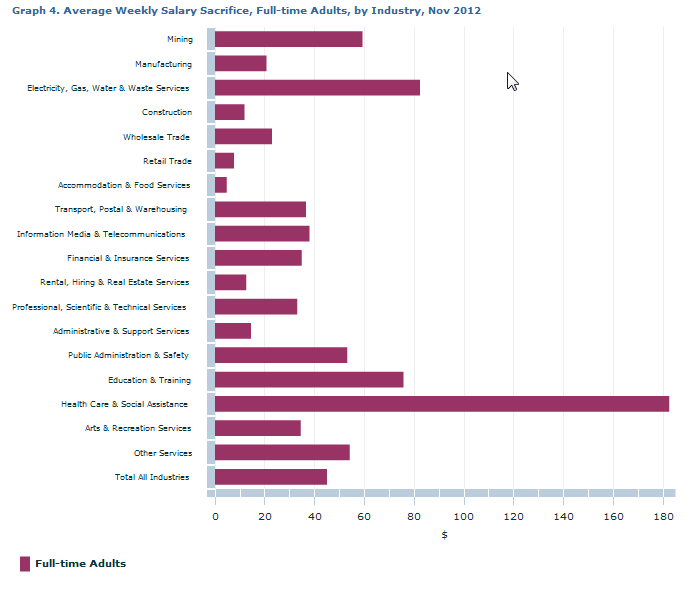
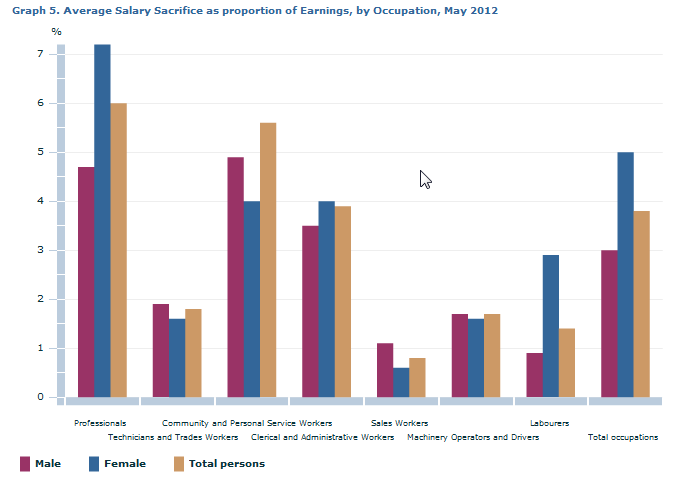
Unless otherwise footnoted, the salary sacrifice amounts are sourced from the AWE survey and can be calculated by subtracting the AWE series from the relevant AWCE series. These series are located under the Downloads tab of this publication. For example, Graph 2, Private sector, Average weekly salary sacrifice for Full-time adults, November 2012: (Table 15, November 2012, AWCE, Private sector, Full-time, Adult, Ordinary time earnings, $1,400.70) minus (Table 6, November 2012, AWE, Private sector, Full-time, Adult, Ordinary time earnings, $1,369.90) equals (November 2012, Private sector, Full-time, Adult, Salary sacrifice, $30.80). AVERAGE WEEKLY SALARY SACRIFICE Graph 1 depicts average weekly amounts of salary sacrifice in Australia for full-time adults over the two years to November 2012.  Source(s): Average Weekly Earnings As can be seen from the above graph, average weekly amounts of salary sacrifice can vary significantly from quarter to quarter. Amounts of salary sacrificed by an employee can be affected by a change in his or her earnings, for example, an increase in the level of overtime worked or commissions earned. Additionally, some employees sacrifice more of their salary at the beginning of the financial year and then the amount tapers off towards the end of the year when he or she has reached the concessional contributions cap for salary sacrificing superannuation. For other employees, the amount of salary sacrificed increases towards the end of the financial year to ensure the cap is reached. In the six months to November 2012, average weekly amounts of salary sacrifice for full-time adults decreased from $52.30 to $45.00 (a decrease of 13.9%). This is largely attributable to the decrease for the 2012-13 financial year in the concessional contributions cap from $50,000 to $25,000 for people aged 50 and over. SECTOR Graph 2 illustrates average weekly amounts of salary sacrifice by sector.  Source(s): Average Weekly Earnings The above data highlights the disparity in average weekly amounts of salary sacrifice between the private and public sectors. In November 2012, the average weekly amount of salary sacrifice by full-time adults in the public sector was $97.30 per week, compared with $30.80 for their counterparts in the private sector. As a proportion of AWE ordinary time earnings, public sector salary sacrifice was also significantly higher than the private sector; public sector average weekly salary sacrifice was 6.5% of full-time adult total earnings, while private sector was 2.2%. One anecdotal explanation for the higher level of public sector salary sacrifice is that there is greater access to salary sacrifice arrangements in this sector. STATES AND TERRITORIES Graph 3 provides a breakdown of the proportion of average total weekly ordinary time earnings that have been salary sacrificed by state and territory and by sex. .gif) Footnote(s): (a) Full-time Adults Source(s): Average Weekly Earnings Graph 3 shows that Tasmania and the Northern Territory had the highest proportion of average weekly amounts of salary sacrifice, particularly amongst female employees. This reflects that these states had a high proportion of employees in the Health care and social assistance industry, which is the industry with by far the greatest average weekly amount of salary sacrifice (as illustrated by Graph 4 below). The Australian Capital Territory (ACT) had the highest proportion of average weekly salary sacrifice for male employees reflecting the high proportion of public sector workers, who, on average, salary sacrifice larger amounts of their earnings than their private sector counterparts (refer Graph 2). Conversely the ACT was the only state or territory where females salary sacrifice less on average than males. The low proportion of average weekly amounts of salary sacrifice for females in the ACT can be attributed to the ACT having a lower proportion of employees in the female dominated Health care and social assistance industry. INDUSTRY Graph 4 shows average weekly amounts of salary sacrifice by industry.  Source(s): Average Weekly Earnings Graph 4 shows that on average, employees in the Health care and social assistance industry salary sacrifice significantly larger amounts of their earnings per week. For November 2012, full-time adults in this industry salary sacrifice on average $182.50 per week, more than double the average of the next highest industry (Electricity, gas, water and waste services; $82.40). As a proportion of full-time adult total earnings, average weekly amounts of salary sacrifice was 14.0% in the Health care and social services industry, compared with the all industries proportion of 3.2%. This is due to the prevalence in this industry of organisations such as hospitals and charitable organisations which have PBI status and, therefore, employees have access to higher FBT-free allowances. Employees of most PBIs are entitled to salary sacrifice up to $30,000 without attracting FBT, while employees of PBIs that are hospitals are entitled to salary sacrifice up to $17,000 FBT-free. OCCUPATION Graph 5 shows the average weekly amount of salary sacrifice as a proportion of total earnings, broken down by broad level occupation, as produced by the biennial Survey of Employee Earnings and Hours.  Graph 5 shows that employees classified as Professionals salary sacrifice the highest percentage of their earnings on average (6.0%). This occupation category includes Health professionals such as registered nurses who are prevalent in hospitals and other organisations with PBI FBT-free entitlements. Education professionals, such as teachers are also included in this category and a significant number of these workers are employed in the public sector, which has higher levels of average salary sacrifice than the private sector (refer Graph 2.). The occupation with the second highest proportion of average weekly amounts of salary sacrifice was Community and Personal Service Workers (5.6%). Many workers classified in this occupation group are employed by organisations with PBI status (for example, Welfare support workers and Aged and disabled carers). Graph 5 also shows that females, on average, salary sacrifice a higher proportion of their earnings than males per week, particularly in the higher skilled occupation group of Professionals. For further Employee Earnings and Hours data, which are produced biannually and are inclusive of salary sacrifice, refer to Employee Earnings and Hours, Australia, May 2012 (cat. no. 6306.0). TYPES OF SALARY SACRIFICE Graph 6 shows the proportions of the types of salary sacrifice benefits, as produced by the Survey of Income and Housing. .gif) As shown by Graph 6, superannuation was by far the most common type of salary sacrifice benefit, accounting for 55.4% of all salary sacrificed income among working persons in Australia. This was followed by vehicles, which accounts for a further 18.8% of salary sacrificed income. For further Household Income and Income Distribution data, refer to Household Income and Income Distribution, Australia, 2009-10 (cat. no. 6523.0). FURTHER INFORMATION Data relating to the AWCE series are available in Excel spreadsheets on the ABS website Downloads tab. For more details on the AWCE series, see the information paper titled Information Paper: Release of Average Weekly Cash Earnings Series (cat. no. 6302.0.55.003). This was released on 21 July 2011 and outlines the background to the series, the classifications and time periods to be released, and where to find the data on the website. For further information about these and related statistics, contact the National Information and Referral Service on 1300 135 070 or Clair Phillips on Perth (08) 9360 5303. Document Selection These documents will be presented in a new window.
|
|
