7503.0 - Value of Agricultural Commodities Produced, Australia, 2011-12 Quality Declaration 
ARCHIVED ISSUE Released at 11:30 AM (CANBERRA TIME) 31/05/2013   
   Page tools: Print Print Page Print all pages in this productPrint All


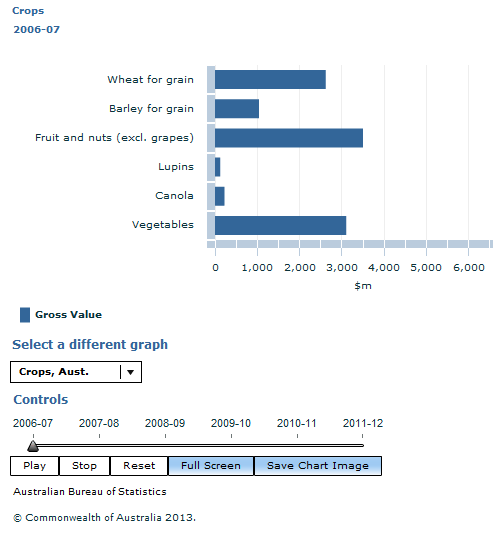
Image: Crops CROPS
  • The gross value of Australian crops increased by 2% to $25.6 billion in 2011-12.
  • The gross value of wheat decreased by 4% nationally, to $6.8 billion. The value of wheat was greatest in Western Australia, doubling to $2.8 billion as a result of increased production in that state.
  • Generally favourable seasonal conditions resulted in increased yields for the majority of crops nationally, which led to increases in gross value. These included cotton (up by 23% to $2.3 billion due to a record harvest in 2012), canola (up by 37% to $1.8 billion) and oats (up by 15% to $255 million).
  • The gross value of fruit and nuts excluding grapes remained steady at $3.0 billion. Both oranges and bananas recovered from a poor year in 2010-11. Production for both crops was close to normal levels after the impacts of the cyclone and/or flooding the previous year. The gross value of oranges increased by 52% to $301 million; the value of bananas increased by 48% to $467 million. However, the gross value of apples fell by 22% to $464 million, with high production in some states leading to a fall in prices for apples generally.
  • The gross value of vegetables remained steady at $3.3 billion. Increases in value were seen in carrots (up by 65% to $215 million) and potatoes (up 13% to $626 million), but decreases were seen for tomatoes (down by 16% to $352 million) and onions (down by 22% to $213 million).


Graph Image for Crops