4430.0 - Disability, Ageing and Carers, Australia: Summary of Findings, 2012  Quality Declaration
ARCHIVED ISSUE Released at 11:30 AM (CANBERRA TIME) 13/11/2013
Page tools:
 Print Page Print Page
 Print All Print All
| ||||
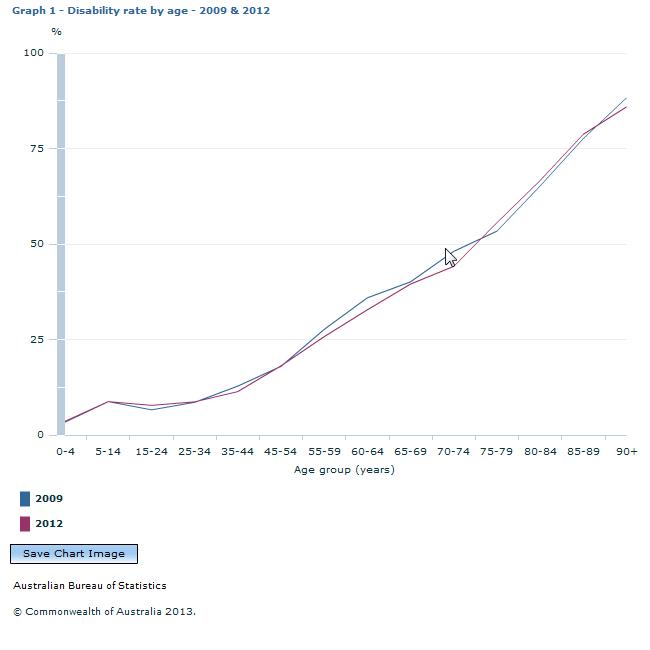
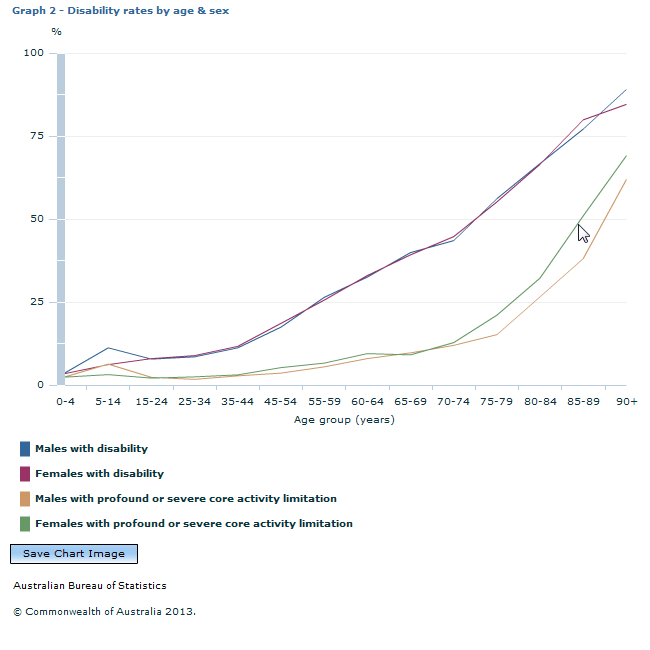
Just under one in five people (4.2 million people or 18.5% of Australians) reported having a disability in 2012. A further 4.7 million people (21%) had a long-term health condition that did not restrict their everyday activities. The remaining 60% of the population had neither a disability or a long-term health condition. For those people with disability, 3.7 million (88%) had a specific limitation or restriction that meant they were limited in the core activities of self care, mobility or communication, or restricted in schooling or employment. (Figure 2) Figure 2: All Persons, Disability status and living arrangements The prevalence of disability in Australia fell by 1.5 percentage points between 2003 and 2012, while the rate of profound or severe core activity limitation remained constant at 6.3% in 2003 and 6.1% in 2012. As disability is correlated with age, it is useful to examine the change with the effects of the ageing population removed from the analysis. The age standardised disability rate for all persons with disability fell by 2.4 percentage points between 2003 and 2012, while the age standardised rate for people with profound or severe core activity limitation fell by 0.4 percentage points. (Tables 1 and 2) Between 2009 and 2012, there were some changes in the proportions of people within each level of core activity limitation. For people with profound core activity limitation, the proportion increased from 2.9% to 3.2% while the proportion of people with severe core activity limitation remained steady. There was a reduction in the proportion of people with moderate core activity limitation (from 3.0% to 2.8%) and an increase in the proportion of people with mild core activity limitation (from 5.6% to 6.0%). (Table 3) The proportion of people with disability within particular age groups has changed between 2009 and 2012, as shown in Graph 1. There were decreases in disability prevalence for age groups 35 to 44 years, 60 to 64 years and 70 to 74 years. (Table 3 and Graph 1)  Source(s): ABS Survey of Disability, Ageing and Carers, Australia: Summary of Findings-2012 Overall, in 2012, there continued to be a smaller proportion of males with disability than females (18% compared with 19%). This difference was most pronounced in older age groups for those with a profound or severe core activity limitation (40% for females compared to 26% for males 75 years and over). The other notable difference between males and females was that more boys than girls in the age group 5 to 14 years had disability (11.2% compared with 6.2%). (Tables 1 and 2 and Graph 2)  Source(s): ABS Survey of Disability, Ageing and Carers, Australia: Summary of Findings-2012 There were differences in disability prevalence across Australia's states and territories, due in part to the differing age structures. In 2012, Tasmania had the highest prevalence of disability, with a quarter of that state’s population living with disability, compared with 16% in Western Australia or the Australian Capital Territory and 12% in the Northern Territory (Table 4). The proportion of the population living with disability increases considerably with age. Tasmania also has the highest proportion of people aged 65 years and over with disability (55%), while the Australian Capital Territory had the lowest proportion (44%). (Table 5) Overall, there was a smaller proportion of people living with disability in Australia's major cities than in inner regional areas (17% and 22%, respectively). (Table 4)
|
||||
