STATE FINAL DEMAND
State final demand (SFD) for the individual states and territories is conceptually equivalent to domestic final demand for Australia as a whole. It represents the sum of household and general government final consumption expenditure and private and public gross fixed capital formation.
In chain volume terms, SFD for the ACT was $31b in 2005-06, an increase of 5% over 2004-05. This compares with a 4% increase in domestic final demand for Australia.
In current price terms, SFD for the ACT was nearly $32b in 2005-06, an increase of 8% over 2004-05. Domestic final demand for Australia increased by 7% over the same period.
4.5 State final demand, ACT and Australia |
|  |
| ACT | Australia | |
| Current prices | Chain volume measures | Current prices | Chain volume measures | |
| $m | % change | $m | % change | $m | % change | $m | % change | |
| |
| 2000-01 | 20 938 | 6.7 | 23 709 | 1.9 | 686 558 | 4.6 | 747 329 | 0.1 | |
| 2001-02 | 22 628 | 8.1 | 24 958 | 5.3 | 734 712 | 7.0 | 780 448 | 4.4 | |
| 2002-03 | 25 468 | 12.6 | 27 120 | 8.7 | 796 200 | 8.4 | 826 448 | 5.9 | |
| 2003-04 | 27 344 | 7.4 | 28 259 | 4.2 | 855 682 | 7.4 | 874 205 | 5.8 | |
| 2004-05 | 29 539 | 8.0 | 29 539 | 4.5 | 914 690 | 6.9 | 914 692 | 4.6 | |
| 2005-06 | 31 803 | 7.7 | 31 001 | 4.9 | 979 574 | 7.1 | 952 796 | 4.2 | |
| |
| Australian National Accounts: State Accounts, 2005-06 (cat. no. 5220.0). |
By splitting final demand into components, the structural differences between the ACT and Australia can be highlighted. In current prices, general government final consumption expenditure (GFCE) represented 52% ($16b) of total final demand in the ACT in 2005-06, versus 18% nationally.
In contrast, household final consumption expenditure (HFCE) represented 34% ($11b) of total final demand in the ACT, versus 56% nationally.
There was also a significant difference in expenditure on private gross fixed capital formation. It was proportionately lower in the ACT than for Australia as a whole in 2005-06, accounting for 10% of SFD, versus 22% nationally.
4.6 Final Demand, ACT and Australia: Current prices - 2005-06 |
| |
| | | ACT | Australia | |
| | | $m | % | $m | % | |
| |
| Final consumption expenditure | | | | | |
| General government | 16 423 | 51.6 | 176 240 | 18.0 | |
| Household | 10 645 | 33.5 | 547 138 | 55.9 | |
| Gross fixed capital formation | | | | | |
| Private | | | | | |
| | Dwellings | 870 | 2.7 | 60 290 | 6.2 | |
| | Non-dwelling construction | 976 | 3.1 | 55 191 | 5.6 | |
| | Machinery and equipment | 839 | 2.6 | 72 130 | 7.4 | |
| | Livestock | - | - | 2 733 | 0.3 | |
| | Intangible fixed assets | 255 | 0.8 | 12 012 | 1.2 | |
| | Ownership transfer costs | 257 | 0.8 | 15 904 | 1.6 | |
| | Total private | 3 197 | 10.1 | 218 261 | 22.3 | |
| Public | 1 539 | 4.8 | 37 935 | 3.9 | |
| State final demand | 31 803 | 100.0 | 979 574 | 100.0 | |
| |
| - nil or rounded to zero (including null cells) |
| Australian National Accounts: State Accounts, 2005-06 (cat. no. 5220.0). |
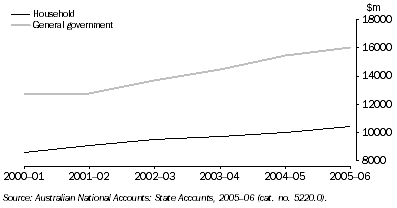
In chain volume terms, HFCE accounted for 39% of total final consumption expenditure in the ACT in 2005-06, with general government accounting for 61%. These proportions have remained relatively constant over time.
4.7 Final consumption expenditure, ACT
: Chain volume measures
In 2005-06 those components of HFCE which took up the largest proportions of total expenditure were consistent between ACT households and households across Australia as a whole:
Rent and other dwelling services was the single largest expenditure item (18% for the ACT versus 17% nationally), followed by
Miscellaneous goods and services (15% and 13%), then
Recreation and culture (13% and 12%).
Expenditure on Electricity, gas and other fuels took up the lowest proportion of HFCE in 2005-06, for the ACT and for Australia as a whole. In the ACT it accounted for approximately 3% of the total, while at the national level it accounted for approximately 2% of the total.
4.8 Household final consumption expenditure: Current prices - 2005-06 |
| |
| ACT | Australia | |
| $m | % | $m | % | |
| |
| Food | 1 152 | 10.8 | 59 854 | 10.9 | |
| Alcoholic beverages and tobacco | 429 | 4.0 | 21 583 | 3.9 | |
| Clothing and footwear | 430 | 4.0 | 20 101 | 3.7 | |
| Rent and other dwelling services | 1 926 | 18.1 | 95 236 | 17.4 | |
| Electricity, gas and other fuels | 288 | 2.7 | 11 225 | 2.1 | |
| Furnishings and other household equipment | 694 | 6.5 | 30 300 | 5.5 | |
| Health | 389 | 3.7 | 27 775 | 5.1 | |
| Transport | 1 089 | 10.2 | 65 143 | 11.9 | |
| Communications | 295 | 2.8 | 15 691 | 2.9 | |
| Recreation and culture | 1 382 | 13.0 | 66 585 | 12.2 | |
| Education services | 333 | 3.1 | 18 617 | 3.4 | |
| Hotels, cafes and restaurants | 717 | 6.7 | 41 735 | 7.6 | |
| Miscellaneous goods and services | 1 629 | 15.3 | 73 293 | 13.4 | |
| Net expenditure interstate | -107 | -1.0 | . . | . . | |
| Total(a) | 10 645 | 100.0 | 547 138 | 100.0 | |
| |
| . . not applicable |
| (a) Total for Australia includes net expenditure overseas. |
| Australian National Accounts: State Accounts, 2005-06 (cat. no. 5220.0). |
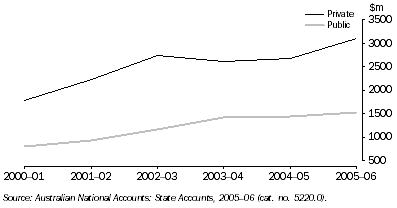
The ACT's expenditure on private fixed capital formation, in chain volume terms, was $3.1b in 2005-06, up 15% on the $2.7b spent in 2004-05.
Expenditure on public fixed capital formation, in chain volume terms, was $1.5b, up nearly $100m (7%) on 2004-05.
4.9 Gross fixed capital formation, ACT
: Chain volume measures