USING TABLEBUILDER
Instructions on how to use TableBuilder can be found in the User Manual: TableBuilder, Jun 2013 (cat. no. 1406.0.55.005) and via the help links within the product itself.
For support in the use of TableBuilder and analysis of the data generated from TableBuilder, please contact Microdata Access Strategies on 02 6252 7714 or via microdata.access@abs.gov.au.
Detailed information about the data collected, comments regarding data quality and other points to assist in using and interpreting the data are contained in Australian Health Survey: Users' Guide, 2011-13 (cat. no. 4363.0.55.001). It is recommended that relevant parts of the guide be read in conjunction with the use of the AHS Core Content TableBuilder.
Weight Variables
The AHS is a sample survey. To produce estimates for the in-scope population you must use weight fields in your tables.
There is a weight variable on each level of the Australian Health Survey (AHS) file on TableBuilder. The default weight variable is 'Persons (Benchmarked weight)' and will meet the majority of table requirements.
Weights can be found under the 'Summation Options' heading in the left-hand pane and are called the following:
Household based weights
'Household level' - 'Households (Benchmarked weight)'
'Persons in household level' - 'Persons in household (Household weight)'
Note that the 'Persons in household (Household weight)' is not recommended to be used as it applies households weights to each individual person in the household and therefore does not provide either household or persons estimates. To obtain household estimates, for example for number of households with males, the sex of person data item on the 'Persons in household level' should be used and then the 'Households (Benchmarked weight)' applied from the 'Household level'.
Person based weights
'Selected persons level' - 'Persons (Benchmarked weight)'
'Conditions level' - 'Conditions (Person weight)'
'Biomedical level' - 'Biomedical persons (Benchmarked weight)'
Note that the 'Conditions (Person weight)' should be used with caution. In most cases the 'Persons (Benchmarked weight)' located on the 'Selected persons level' will be the preferred weight to use. See the example below in Using Weights which demonstrates differences in estimates produced using each weight for the same data item.
Using Weights
The AHS is a sample survey. To produce estimates for the in-scope population you must use weight fields in your tables. If you do not select a weight field, TableBuilder will use 'Persons (Benchmarked weight)' by default. This will give you estimates of the number of persons. To produce estimates of the number of households, you would have to change the weight field to 'Households (Benchmarked weight)' by adding it to your table from the Household level. This rule also applies to the Biomedical level items. To produce estimates of the number of persons selected in the National Health Measures Survey (NHMS) you would have to change the weight field to 'Biomedical persons (Benchmarked weight)' by adding it to your table from the Biomedical level.
The Household Weight was benchmarked to the Household Level, the Person Weight was benchmarked to the Selected persons level and the Biomedical persons Weight was benchmarked to the Biomedical level. When using a Weight/Summation from a level that is different to that of the variables in the table please be careful in interpreting the results.
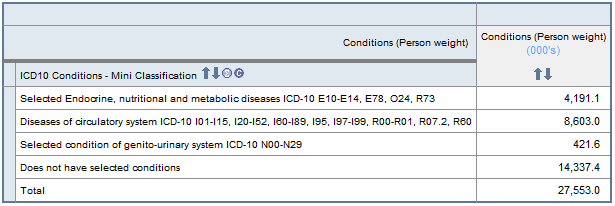
For example, a table of reported conditions using the 'Persons (Benchmarked weight)' will show the number of persons reporting each condition.

The same table using the 'Conditions (Person weight)' will show the number of conditions reported. This number is larger, as if a person reports more than one condition in the category, their person weight contributes to the cell multiple times. This is an estimate of the number of conditions but is not benchmarked and therefore these weights should be used with caution.
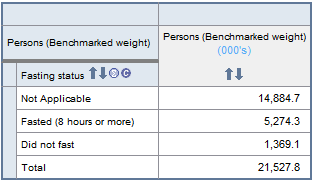
In another example, a table of reported fasting status using the 'Persons (Benchmarked weight)' will show the fasting status for the entire AHS survey. Note that 'Not applicable' persons include those people who did not participate in the NHMS and those persons aged 5 to 11 years who participated in the NHMS but were only required to provide a urine sample.
The same table using the 'Biomedical persons (Benchmarked weight)' will show the fasting status for persons only selected to participate in the NHMS. Note that in this case, 'Not applicable' persons are those people aged 5 to 11 years who participated in the NHMS but were only required to provide a urine sample. People who did not participate in the biomedical component do not have a biomedical person weight and therefore do not contribute to the table when this weight is used.
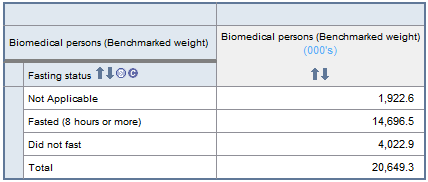
The 'Biomedical persons (Benchmarked weight)' must be used for all tables where a biomedical level data item is being used. This includes where biomedical items are being used with items from other levels.
You can use a weight field with classificatory fields from other levels but should take care when interpreting the results. Below are some examples which you can use as a guide.
| Weight Field | Classificatory Field | Relative Position of Data to Weight | Example Estimate |
| Persons (Benchmarked weight) | State or Territory | Above | Number of persons in NSW |
| Persons (Benchmarked weight) | Sex of Person | Same | Number of Males |
| Persons (Benchmarked weight) | Type of Condition | Below | Number of persons who have 1 or more types of endocrine, nutritional and metabolic disease |
| Biomedical persons (Benchmarked weight) | Fasting status | Same | Number of persons who fasted for 8 hours or more |
Additional Note on Continuous Items
Some continuous data items are allocated special codes for certain responses (e.g. 9999 = 'Not applicable'). These data items will appear twice – once under ‘Summation Options’ and once in the list of categorical variables. Categories will include ‘A valid response was recorded’ and a category for each special code. Any special codes for continuous data items are listed in the Data Item List, which is available in Excel spreadsheet format from the
Downloads page of this product.
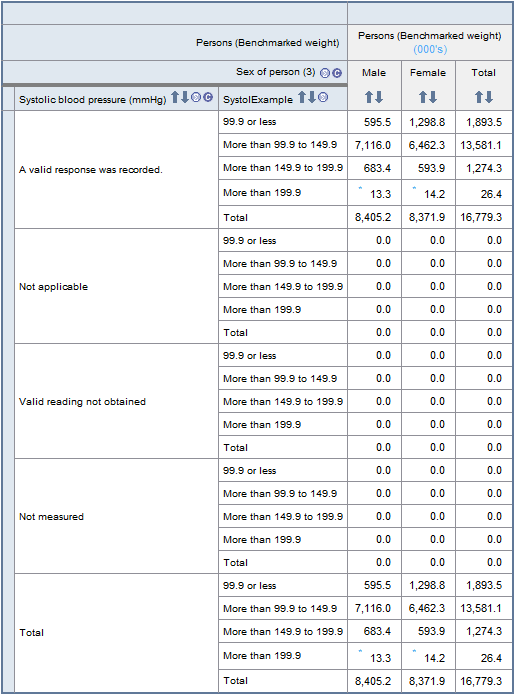
When creating ranges for these continuous items for use in TableBuilder, special codes will NOT be included in the ranges. Therefore the total shown only represents 'valid responses' of that continuous data item, rather than all responses.
For example, the following table shows the responses for 'Systolic Blood Pressure' by 'Sex of person'. The continuous values of the data item are contained in the 'A valid response was recorded' row. If the actual continuous values are to be displayed then it is necessary to create a range for them. For information on constructing ranges see the
User Manual: TableBuilder, Jun 2013 (cat. no. 1406.0.55.005).
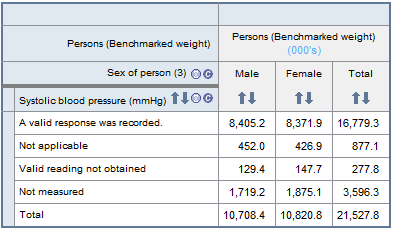
Here is the same table with a range applied for the continuous values of 'Systolic Blood Pressure' (SystolExample). Note that the numbers of respondents for the other responses 'Not applicable', 'Valid reading not obtained' and 'Not measured' no longer contribute to the table.
Continuous items can be used to create custom categories in 'My Custom Data' by first ranging the item. For example, to create five year age groupings this can be done by ranging the item with a five year increment. However, to deviate from groupings of equal increments, this must be done in 'My Custom Data'. As age is a continuous item, it must first be ranged (for example in one year increments) and then this ranged item can be grouped under the 'My Custom Data' tab to form unique age categories. For more information see the 'My Custom Data' section of the
User Manual: TableBuilder, Jun 2013 (cat. no. 1406.0.55.005).
Any special codes for continuous data items are listed in the Data Item List, which is available in Excel spreadsheet format from the
Downloads page of this product.
Means and Medians
Means and medians of continuous data items are calculated at the level of the continuous data item and therefore use the weight at that level. Due to current functionality of the software, a weight from another level cannot be brought into such calculations. The "subject" of means and medians calculated in Table Builder is therefore the statistical unit associated with the level of the database on which the continuous data item is stored.
CONFIDENTIALITY FEATURES IN TABLEBUILDER
In accordance with the
Census and Statistics Act 1905, all the data in TableBuilder are subjected to a confidentiality process before release. This confidentiality process is undertaken to avoid releasing information that may allow the identification of particular individuals, families, households, dwellings or businesses.
Processes used in TableBuilder to confidentialise records include the following:
The following microdata products are currently available from this survey:
- perturbation effects
- table suppression
- field exclusion rules
Perturbation Effects
To minimise the risk of identifying individuals in aggregate statistics, a technique is used to randomly adjust cell values. This technique is called
perturbation. Perturbation involves small random adjustments of the statistics and is considered the most satisfactory technique for avoiding the release of identifiable statistics while maximising the range of information that can be released. These adjustments have a negligible impact on the underlying pattern of the statistics.
The introduction of these random adjustments result in tables not adding up. While some datasets apply a technique called
additivity to give internally consistent results, additivity has not been implemented on this TableBuilder. As a result, randomly adjusted individual cells will be consistent across tables, but the totals in any table will not be the sum of the individual cell values. The size of the difference between summed cells and the relevant total will generally be very small.
Please be aware that the effects of perturbing the data may result in components being larger than their totals. This includes determining proportions.
Table Suppression
Some tables generated within TableBuilder may contain a substantial proportion of very low counts within cells (excluding cells that have counts of zero). When this occurs, all values within the table are suppressed in order to preserve confidentiality. The following error message below is displayed at the bottom of the table when table suppression has occurred.
ERROR: The table has been suppressed as it is too sparse
ERROR: table cell values have been suppressed
Field Exclusion Rules
Certain groups of similar variables are restricted from being used together in a table. These restrictions are referred to as
field exclusion rules, and are in place in order to protect confidentiality. The collections of similar variables restricted in this way are called
field exclusion groups.
For the Australian Health Survey, there is one field exclusion group. This consists of the 2006 and 2011 geographical and Socio-Economic Indexes for Areas (SEIFA) data items (see below for items).
Only one data item from this group may be used in a single table.
The geographic exception to this is the State or Territory item, which can be used in addition to one item from this group.
Items included in the field exclusion group are:
2006 Geographic Items
- ASGC remoteness area categories
- Capital city and balance of state
- Section of state
2011 Geographic Items
- Remoteness area categories ASGS 2011
- Greater Capital City Statistical Areas ASGS 2011
- Section of state ASGS 2011
- Medicare Locals
- Peer Groups (MLs)
2006 SEIFA Items
- Index of Relative Socio-economic Advantage and Disadvantage -2006 - CD - Deciles - National
- Index of Relative Socio-economic Advantage and Disadvantage - 2006 - CD - Deciles - State
- Index of Relative Socio-economic Advantage and Disadvantage - 2006 - SLA - Deciles - National
- Index of Relative Socio-economic Advantage and Disadvantage - 2006 - SLA - Deciles - State
- Index of Relative Socio-economic Disadvantage - 2006 - CD - Deciles - National
- Index of Relative Socio-economic Disadvantage - 2006 - CD - Deciles - State
- Index of Relative Socio-economic Disadvantage - 2006 - SLA - Deciles - National
- Index of Relative Socio-economic Disadvantage - 2006 - SLA - Deciles - State
- Index of Economic Resources - 2006 - CD - Deciles - National
- Index of Economic Resources - 2006 - CD - Deciles - State
- Index of Economic Resources - 2006 - SLA - Deciles - National
- Index of Economic Resources - 2006 - SLA - Deciles - State
- Index of Education and Occupation - 2006 - CD - Deciles - National
- Index of Education and Occupation - 2006 - CD - Deciles - State
- Index of Education and Occupation - 2006 - SLA - Deciles - National
- Index of Education and Occupation - 2006 - SLA - Deciles - State
2011 SEIFA Items
- Index of Relative Socio-economic Advantage and Disadvantage - 2011 - SA1 - Deciles - National
- Index of Relative Socio-economic Advantage and Disadvantage - 2011 - SA1 - Deciles - State
- Index of Relative Socio-economic Advantage and Disadvantage - 2011 - SA2 - Deciles - National
- Index of Relative Socio-economic Advantage and Disadvantage - 2011 - SA2 - Deciles - State
- Index of Relative Socio-economic Disadvantage - 2011 - SA1 - Deciles - National
- Index of Relative Socio-economic Disadvantage - 2011 - SA1 - Deciles - State
- Index of Relative Socio-economic Disadvantage - 2011 - SA2 - Deciles - National
- Index of Relative Socio-economic Disadvantage - 2011 - SA2 - Deciles - State
- Index of Economic Resources - 2011 - SA1 - Deciles - National
- Index of Economic Resources - 2011 - SA1 - Deciles - State
- Index of Economic Resources - 2011 - SA2 - Deciles - National
- Index of Economic Resources - 2011 - SA2 - Deciles - State
- Index of Education and Occupation - 2011 - SA1 - Deciles - National
- Index of Education and Occupation - 2011 - SA1 - Deciles - State
- Index of Education and Occupation - 2011 - SA2 - Deciles - National
- Index of Education and Occupation - 2011 - SA2 - Deciles - State.
 Print Page
 Print All
 Quality Declaration