|
NORTHERN TERRITORY ECONOMY |
The economy of the Northern Territory continued to grow during the 2005-06 financial year when compared to the previous two financial years. Gross state product (GSP) has risen from $8 670 million in 2003-04 to $11 476 million in 2005-06, an increase of 32.4%. This is higher than the increase in the Australian Gross Domestic Product (GDP) for the same period, which was 31.1%. GSP per capita in the Northern Territory ($55 925) is also higher than GDP per capita for Australia ($45 021). This can be attributed to the recent mining and resources boom.
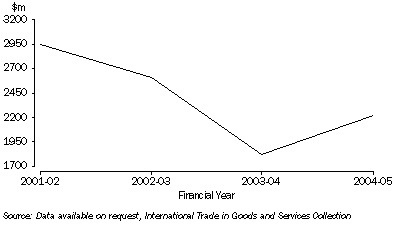
Exports in 2005-06 were 19% higher than in 2004-05. In 2005-06 the largest contributor to the value of exports from the Northern Territory was: oil and gas (33.4%); followed by metal ores (20.6%); other manufacturing (5.9%); and agriculture (4.9%). However, there has been a decrease in the value of exports when compared to the 2001-02 financial year. This has been largely due to fluctuations in oil and gas extraction, decreasing from $1498.7 million in 2001-02 and to $493.7 million in 2004-05, combined with a more moderate decrease in agricultural exports. These declines were significantly (but not totally) offset by increases in metal ore mining and other manufacturing over the same period.
Value of exports, Northern Territory
: 2001-05

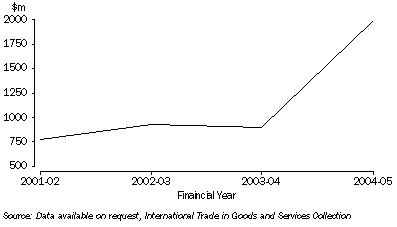
Imports into the NT in 2005-06 totalled $2 887.8 million, consisting mainly of machinery and equipment manufacturing (58.4%) and petroleum, coal, chemical and associated product manufacturing (17.0%). Imports in 2005-06 were 45.1% higher than in 2004-05 mainly in the area of machinery and equipment manufacturing.
There has also been a significant increase in the value of imports into the Northern Territory over 2001-02 and 2005-06 period. In terms of the largest percentage increase, imports in the area of oil and gas extraction went from $4.8 million to $156.7 million. In terms of the largest dollar value, imports of manufacturing machinery and equipment went from $241.4 million to $1.69 billion. Petroleum, coal, chemical and associated product imports also increased significantly from $161.4 million to $490 million.
Imports Merchandise Trade, Northern Territory
: 2001-05

In the 2005-06 financial year Darwin City Council remained the largest council, with financial expenditure totalling $42.4 million. Tiwi islands ($27.7 million) was next in terms of expenditure, followed by Alice Springs Town Council ($17.9 million) and Palmerston Town Council ($16.2 million). Nearly half (44%) of all councils had expenditure exceeding revenue, the majority being remote area communities (including townships of Jabiru and Tennant Creek).
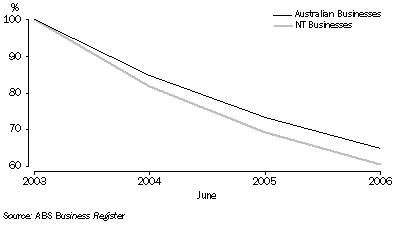
Between 2003-04 and 2005-06 the number of businesses operating in the Northern Territory dropped from 13 650 to 13 418. Of the 13 650 businesses operating in June 2003, 81.9% survived to June 2004, 69.3% survived to June 2005, and 60.4% survived to June 2006. This survival rate is lower than the Australian rates for the equivalent periods. Of the 1 868 969 businesses operating in Australia in June 2003, 84.8% survived to June 2004, 73.4% survived to June 2005, and 65.0% survived to June 2006.
During the 2003-04 year there were 2222 new business entries in the Northern Territory, of which 69.2% survived to June 2005, and 50.6% survived to June 2006. The survival rate of new NT business entries is also lower than the Australian survival rate. 75.4% of the new businesses entries in June 2003-04 survived to June 2005, and 58.3% survived to June 2006.
Survival of Businesses Operating in June 2003, Northern Territory
: 2003-2006

Further information on the economy of the Northern Territory can be found at the following sources:
Northern Territory Treasury
Australian National Accounts: State Accounts (cat. no. 5220.0)
Counts of Australian Businesses, Including Entries and Exits (cat. no. 8165.0)
 Print Page
 Print All