Includes: population, births, deaths, overseas migration, regional mobility, cultural and linguistic diversity and population projections. Detailed statistics are available in 1338.1 NSW in Focus - Population - 2007 (27 Kb, xls).
Population, NSW Summary table |
|  |
 |  | 2000 | 2001 | 2002 | 2003 | 2004 | 2005(a) | 2006(a) |  |
Population composition(b) |  |
|  |
| 1. Males | '000 | 3 219.1 | 3 264.2 | 3 295.9 | 3 321.4 | 3 343.1 | 3 368.7 | 3 397.7 |  |
| 2. Females | '000 | 3 267.1 | 3 311.0 | 3 338.2 | 3 360.7 | 3 377.7 | 3 400.3 | 3 430.0 |  |
| 3. Persons | '000 | 6 486.2 | 6 575.2 | 6 634.1 | 6 682.1 | 6 720.8 | 6 768.9 | 6 827.7 |  |
| 4. Aged 0-14 years | % | 20.6 | 20.4 | 20.2 | 19.9 | 19.7 | 19.4 | 19.2 |  |
| 5. Aged 15-64 years | % | 66.5 | 66.5 | 66.6 | 66.7 | 66.8 | 66.9 | 67.0 |  |
| 6. Aged 65 years and over | % | 13.0 | 13.1 | 13.2 | 13.3 | 13.5 | 13.7 | 13.9 |  |
| 7. Aged 85 years and over | % | 1.4 | 1.4 | 1.5 | 1.5 | 1.5 | 1.6 | 1.7 |  |
| 8. Median age-Total | years | 35.7 | 35.9 | 36.2 | 36.4 | 36.7 | 36.9 | 37.1 |  |
| 9. Median age-Indigenous | years | na | 20.1 | na | na | na | na | na |  |
| 10. Indigenous Population | '000 | na | 134.9 | na | na | na | na | na |  |
| 11. Australian born | % | na | 75.2 | na | na | na | na | na |  |
| 12. Overseas born | % | na | 24.8 | na | na | na | na | na |  |
| 13. Speaks language other than English at home(c) | % | na | 18.9 | na | na | na | na | na |  |
| 14. Settler Arrivals | '000 | 39.3 | 46.7 | 35.3 | 36.4 | 40.6 | 44.7 | 44.7 |  |
| 15. Sydney SD as a proportion of NSW | % | 62.7 | 62.8 | 62.8 | 62.8 | 62.9 | 62.9 | 62.9 |  |
| 16. NSW as a proportion of Australia | % | 33.9 | 33.9 | 33.8 | 33.6 | 33.5 | 33.3 | 33.1 |  |
Population growth(d) |  |
|  |
| 17. Births | '000 | 85.8 | 85.4 | 84.1 | 84.9 | 85.7 | 84.2 | 86.7 |  |
| 18. Deaths | '000 | 45.1 | 45.7 | 45.2 | 46.1 | 46.4 | 45.6 | 46.3 |  |
| 19. Natural increase | '000 | 40.8 | 39.7 | 38.9 | 38.8 | 39.4 | 38.6 | 40.5 |  |
| 20. Net overseas migration(e) | '000 | 43.7 | 58.6 | 44.4 | 40.9 | 29.8 | 35.2 | 42.2 |  |
| 21. Net interstate migration | '000 | -14.3 | -16.3 | -24.4 | -31.8 | -30.4 | -25.7 | -24.0 |  |
| 22. Total population growth | '000 | 74.8 | 89.0 | 58.9 | 47.9 | 38.7 | 48.1 | 58.8 |  |
| 23. Annual growth rate | % | 1.2 | 1.4 | 0.9 | 0.7 | 0.6 | 0.7 | 0.9 |  |
| 24. Total fertility rate(f)(g) | rate | 1.815 | 1.762 | 1.801 | 1.796 | 1.794 | 1.757 | (h)1.808 |  |
|  |
| na not available |
| (a) 2005 data are based on revised data. 2006 data are based on preliminary ERP. Figures may differ to those published in 2005 due to revisions of the ERP. |
| (b) At 30 June. |
| (c) At 7 August 2001, based on 2001 Census of Population and Housing. |
| (d) Data are for 12 months to 30 June. |
| (e) Net overseas migration is the sum of the net permanent and long term movement, plus migration and adjustment. |
| (f) Births per woman. |
| (g) Calculated using revised births on occurrence basis and revised ERP unless otherwise stated in the table. |
(h) Calculated using preliminary births on registration basis and preliminary ERP.
|
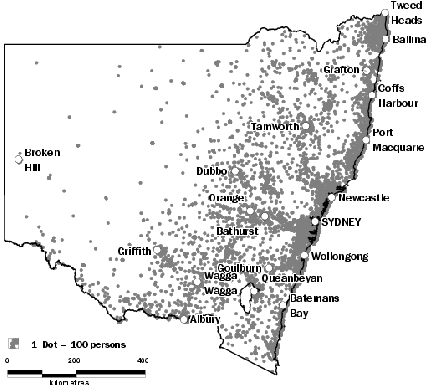
Population density - 2006

Source: ABS Estimated Resident Population Collection
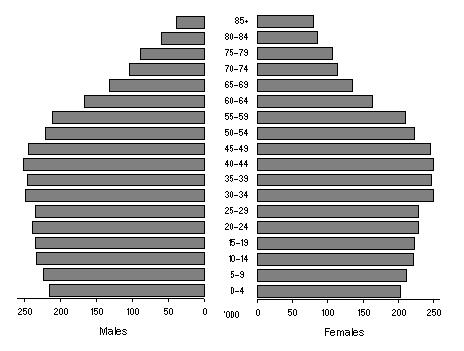
Age population pyramid - 2006

Source: Population by Age and Sex, Australian States and Territories (ABS cat. no. 3201.0)
SOURCES: |
|  |
| Data in this table are compiled from multiple sources. Information on these sources is available below. | Summary table indicators | Graphics |  |
|  |
| ABS data available on request, ABS 2001 Census of Population and Housing | 13 | . . |  |
| ABS data available on request, ABS Overseas Arrivals and Departures Collection | 14 | . . |  |
| ABS data available on request, ABS Vitals Collection | . . | . . |  |
| ABS data available on request, ABS Estimated Resident Population Collection | . . | 1.2 |  |
| Australian Demographic Statistics (ABS cat. no. 3101.0) | 1-3; 17-24 | . . |  |
| Australian Historical Population Statistics (ABS cat. no. 3105.0.65.001) | . . | . . |  |
| Births, Australia (ABS cat. no. 3301.0) | . . | . . |  |
| Deaths, Australia (ABS cat. no. 3302.0) | . . | . . |  |
| Department of Immigration and Citizenship | . . | . . |  |
| Experimental Estimates and Projections, Aboriginal and Torres Strait Islander Australians (ABS cat. no. 3238.0) | 9-10 | . . |  |
| Life Tables, New South Wales (ABS cat. no. 3302.1.55.001) | . . | . . |  |
| Migration, Australia (ABS cat. no. 3412.0) | 11-12 | . . |  |
| Population by Age and Sex, Australian States and Territories (ABS cat. no. 3201.0) | 4-8 | 1.3 |  |
| Population Projections, Australia (ABS cat. no. 3222.0) | . . | . . |  |
| Regional Population Growth, Australia (ABS cat. no. 3218.0) | 15-16 | . . |  |
|  |
| . . not applicable |
For links to the ABS publications cited above, see Related Information.
 Print Page
 Print All