Feature Article: Marriages and Divorces, Australia, 2003
INTRODUCTION
The following article is, in part, reprinted from the Main Features of Marriages, Australia (cat.no. 3306.0.55.001) and Divorces, Australia (cat.no. 3307.0.55.001). These products are now available from the ABS web site.
MARRIAGES, AUSTRALIA
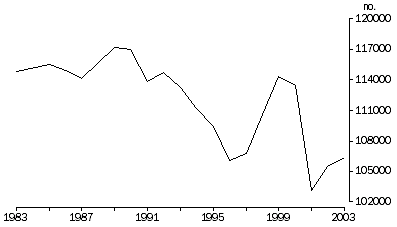
In 2003 there were 106,400 marriages registered in Australia, an increase of 960 when compared with 2002, and continuing the increase in the number of marriages since the low of 103,130 in 2001. While 2003 recorded an increase in the number of marriages registered, the crude marriage rate (per 1,000 of the population) stabilised at 5.4, the same rate as recorded for 2002. The crude marriage rate has been in decline for the last two decades, dropping from 7.5 in 1983 to 6.4 in 1993. Marriage rates (per 1,000 of unmarried population) have also continued to fall over the last two decades. In 1983 there were 55 marriages of males and 53 marriages of females, per 1,000 of the unmarried population of each respective sex. By 2001 this had fallen to 31 for males and 28 for females.
TOTAL MARRIAGES AUSTRALIA — 1983-2003

REMARRIAGE RATES
Remarriage rates for the divorced population have continued the downward trend. From 1986 to 2001 remarriage rates for divorced males have dropped from 94 (per 1,000 of the divorced male population) in 1986, to 74 in 1991, to 47 in 2001. Similarly, remarriage rates for divorced females have fallen from 70 (per 1,000 of the divorced female population) in 1986 to 57 in 1991, and to 34 in 2001.
Remarriage rates for the widowed population shrunk between 1986 and 2001. During this period remarriage rates for widowed males fell from 20 (per 1,000 of the widowed male population) in 1986, to 16 in 1991, and to 12 in 2001. However there is much less variation in the remarriage rates for widows. In 1986 the remarriage rate for widows was 5 (per 1,000 of the female widowed population) and 3 in 2001.
AGE AT MARRIAGE
The trend towards older ages at marriage continued in 2003. The median age at marriage (the age at which there are as many people marrying above the age as there are below it) for men was 31.2 years, rising from 28.8 years in 1993. For women the median age at marriage rose to 29.1 years from 26.4 years in 1993.
The median age at first marriage has increased for men from 27.0 years in 1993 to 29.2 years in 2003, and for women from 24.8 years to 27.3 years.
COHABITATION PRIOR TO MARRIAGE
Marriage data for 2003 confirms the thirty year trend for more Australian couples to cohabit prior to entering a registered marriage. In 1975, only 16% of couples cohabited prior to marriage, increasing to 27% in 1983, while 75% of couples cohabited prior to marriage in 2003.
In 2003, couples living in Tasmania were the most likely to cohabit before marriage (83% of all marriages) while those living in New South Wales were the least likely to cohabit prior to marriage (70% of all marriages).
FIRST MARRIAGES AND REMARRIAGES
In 2003, marriages in which neither party had been previously married comprised 66% of all marriages registered. A further 18% were first marriages for one partner and remarriage for the other, and 15% were remarriages for both partners. These proportions were similar to those recorded in 1983.
DIVORCES, AUSTRALIA
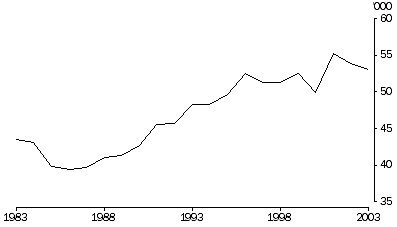
There were 53,100 divorces granted in Australia in 2003, representing a decrease of 2% (or 860 divorces) compared with divorces granted in 2002 (54,000). Divorces granted in 2003 were the third highest number granted in the last 20 years, with divorces granted in 2001 (55,300) being the highest. Divorces in 2003 represent an increase of 10% on the number granted 10 years ago (48,400) and 22% on the number granted 20 years ago (43,500).
DIVORCES GRANTED, Australia

AGE AT DIVORCE
The median age at divorce continued to increase in 2003. The median age of men at divorce was 42.6 years, up from 42.2 years in 2002 and 39.3 years in 1993. The median age of men at divorce has increased by 6.3 years over the last 20 years. For women, the median age at divorce for 2003 increased to 39.9 years, up from 39.5 years in 2002 and 36.4 years in 1993. The median age of women at divorce has increased by 6.2 years over the last 20 years.
The rise in the median age at divorce is associated with increasing age at first marriage and to some extent the increase in the interval between marriage and divorce. The median age at first marriage for males was 29.2 years in 2003, up from 29.0 years in 2002 and 27.0 years in 1993. For females, the median age at first marriage was 27.3 years in 2003, up from 27.1 years in 2002 and 24.8 years in 1993. More information about marriage statistics can be found in Marriages, Australia 2003 (cat. no. 3306.0.55.001).
DURATION OF MARRIAGE FOR DIVORCING COUPLES
The median duration of marriage to both separation and divorce is increasing over time, revealing that marriages are, on average, lasting longer. The median duration of marriage to separation in 2003 was 8.7 years, compared with 8.6 years in 2002 and 7.6 years in 1993. The median duration of marriage to divorce in 2003 was 12.2 years, compared with 12.0 years in 2002 and 10.7 years in 1993.
In 2003, 6% of divorces involved separation within the first year of marriage, 33% within the first five years and a further 22% were separated within five to nine years of marriage. Of the divorcing couples in 2003, 17% were married less than five years, 25% between five and nine years and 59% were married for 10 years or more. Around 16% of divorces occurred to couples who had been married for 25 years or more.
APPLICANT FOR DIVORCE
As in previous years, more women (43%) than men (32%) lodged applications for divorce in 2003. The remainder of divorces granted in 2003 (25%) were the result of joint applications. The median duration of marriage to divorce was shorter for female and joint applicants (each 11.5 years) than for male applicants (13.7 years).
DIVORCES INVOLVING CHILDREN
Over the last 10 years, the proportion of divorces involving children under 18 years has fallen slightly from 53% in 1993 to 50% in 2003. The actual number of children involved in divorce in 2003 (49,900) was down 1% compared with 2002 (50,500) and up 4% compared with 1993 (48,100).
Of divorces involving children in 2003, the age of the youngest child was between 0 to 4 years of age for 26% of divorces, 5 to 9 years of age for 36% of divorces and 10 to 17 years for 38% of divorces.
 Print Page
 Print All