APPENDIX ADJUSTED MEASURES OF GOVERNMENT REVENUE
The taxation revenue statistics presented in this release are in accordance with the Australian System of Government Finance Statistics (GFS). This system is outlined in the Australian System of Government Finance Statistics: Concepts, Sources and Methods (cat. no. 5514.0) which is consistent with the International Monetary Fund's Government Finance Statistics Manual 2001 (IMF GFSM2001).
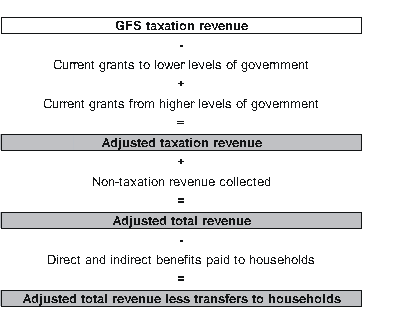
The GFS framework reflects taxation revenue collected by each level of government. The purpose of this appendix is to consider an alternative presentation of revenue which takes into account the level of government at which revenue is used rather than simply collected. The analysis considers the flows, by way of current grants, that occur between the levels of government in Australia, and the impact that this has on revenue at each of these levels. Also considered is the effect of direct and indirect transfers to households on total revenue. To aid in the understanding of these flows, the following analytical measures of revenue have been derived. Users should note that these measures are not themselves part of the GFS framework.
Adjusted taxation revenue
Adjusted taxation revenue is equal to GFS taxation revenue collected by each level of government, plus current grants received from higher levels of government, less current grants paid to lower levels of government. This measure is designed to give a clearer indication of the levels of government at which taxation revenue is actually used or spent. The source for a significant amount of the current grants distributed between levels of government is taxation revenue, such as the GST. However, some of the revenue distributed may have come from a source other than taxation. Further, it should be noted that some of the current grants transferred from Commonwealth Government to the state and local governments are Specific Purpose Payments (SPPs). Unlike the GST-related grants, these payments are 'tied' to specific policy areas as agreed between the two levels of government. Similar arrangements exist between state and local government. SPPs for current purposes are included with other current grants in deriving adjusted taxation revenue.
Adjusted total revenue
Adjusted total revenue is equal to adjusted taxation revenue plus all other non-taxation sources of revenue. Non-taxation revenue includes revenue from sales of goods and services, property income (interest, dividends, income tax equivalents, land rents and royalties), fines, capital transfers, and current transfers other than grants. Current grants are excluded from non-taxation revenue because these have already been taken into account in deriving adjusted taxation revenue.
Adjusted total revenue less transfers to households
An important role of government is the redistribution of income, by way of direct and indirect 'benefits', to individual households. These transfers can be deducted from adjusted total revenue to derive adjusted total revenue less transfers to households. Direct benefits are regular cash payments made to households by government without any requirement to provide goods and services in return (e.g. welfare payments). Indirect benefits are non-cash benefits and services provided by government to individual households (e.g. concessions for transport and utilities, medical and pharmaceutical benefits and natural disaster relief).
The three derived measures explained above are illustrated in the following diagram:

An analysis along similar lines was first published in
Australian Economic Indicators, March 2006 (cat. no. 1350.0), in a feature article entitled "Recent Taxation Revenue Trends in Australia". This article included information on the introduction of The New Tax System on 1 July 2000.
Adjusted total revenue as a proportion of Gross Domestic Product (GDP)
The current price estimate of GDP is used to calculate the ratios in the following tables. This is obtained by reflating the average chain volume estimate, derived from the three independent approaches, by the implicit price deflator derived from the expenditure-based estimates. GDP is as published in Table 43, Expenditure on GDP, Current Prices in the December quarter 2009 issue of
Australian National Accounts: National Income, Expenditure and Product (cat. no. 5206.0).
Adjusted taxation revenue
Table 1 shows the derivation of adjusted taxation revenue, for all three levels of government in Australia.
TABLE 1. ADJUSTED TAXATION REVENUE, by level of government, and as % of GDP(a) |
|
 | 2003-04 | 2004-05 | 2005-06 | 2006-07 | 2007-08 | 2008-09 |
 | $m | $m | $m | $m | $m | $m |
COMMONWEALTH |
|
| 1. Taxation revenue collected(b) | 209 560 | 229 131 | 245 223 | 261 988 | 285 672 | 278 002 |
| As % of GDP | 24.2 | 24.7 | 24.5 | 24.0 | 24.2 | 22.1 |
| As % of total tax revenue | 81.5 | 82.3 | 82.4 | 81.9 | 82.0 | 82.0 |
| 2. Current grants to state government(c) | 53 801 | 57 560 | 61 393 | 63 873 | 69 480 | 73 087 |
| 3. Current grants to local government | 351 | 305 | 81 | 56 | 89 | 46 |
| 4. Current grants to multi-jurisdictional sector(d) | 4 788 | 4 839 | 5 556 | 5 589 | 7 347 | 6 691 |
| 5. Adjusted taxation revenue =1-2-3-4(e) | 150 620 | 166 427 | 178 193 | 192 470 | 208 756 | 198 178 |
| As % of GDP | 17.4 | 18.0 | 17.8 | 17.6 | 17.7 | 15.7 |
| As % of total tax revenue | 58.5 | 59.7 | 59.8 | 60.2 | 59.9 | 58.5 |
STATE |
|
| 1. Taxation revenue collected(b) | 40 410 | 41 667 | 44 246 | 48 870 | 53 130 | 50 627 |
| As % of GDP | 4.7 | 4.5 | 4.4 | 4.5 | 4.5 | 4.0 |
| As % of total tax revenue | 15.7 | 15.0 | 14.9 | 15.3 | 15.3 | 14.9 |
| 2. Current grants from Commonwealth government | 53 801 | 57 560 | 61 393 | 63 873 | 69 480 | 73 087 |
| 3. Current grants to local government | 1 842 | 1 770 | 2 005 | 2 184 | 2 338 | 3 252 |
| 4. Current grants to multi-jurisdictional sector(d) | 265 | 381 | 297 | 277 | 328 | 461 |
| 5. Adjusted taxation revenue =1+2-3-4(e) | 92 104 | 97 075 | 103 337 | 110 282 | 119 943 | 120 001 |
| As % of GDP | 10.6 | 10.5 | 10.3 | 10.1 | 10.1 | 9.5 |
| As % of total tax revenue | 35.8 | 34.8 | 34.7 | 34.5 | 34.4 | 35.4 |
LOCAL |
|
| 1. Taxation revenue collected(b) | 7 671 | 8 183 | 8 726 | 9 404 | 10 128 | 10 874 |
| As % of GDP | 0.9 | 0.9 | 0.9 | 0.9 | 0.9 | 0.9 |
| As % of total tax revenue | 3.0 | 2.9 | 2.9 | 2.9 | 2.9 | 3.2 |
| 2. Current grants from Commonwealth government | 351 | 305 | 81 | 56 | 89 | 46 |
| 3. Current grants from state government | 1 842 | 1 770 | 2 005 | 2 184 | 2 338 | 3 252 |
| 4. Adjusted taxation revenue = 1+2+3(e) | 9 864 | 10 258 | 10 813 | 11 644 | 12 555 | 14 173 |
| As % of GDP | 1.1 | 1.1 | 1.1 | 1.1 | 1.1 | 1.1 |
| As % of total tax revenue | 3.8 | 3.7 | 3.6 | 3.6 | 3.6 | 4.2 |
TOTAL |
|
| Gross Domestic Product | 864 955 | 925 864 | 1 000 787 | 1 091 327 | 1 181 750 | 1 258 870 |
| Total taxation revenue collected | 257 269 | 278 577 | 297 760 | 319 752 | 348 330 | 338 878 |
| As % of GDP | 29.7 | 30.1 | 29.8 | 29.3 | 29.5 | 26.9 |
|
| (a) As published in Australian National Accounts, December Quarter 2009 (Cat. no. 5206.0), Table 43 of the PDF, Expenditure on GDP, Current Prices: Annual. |
| (b) According to GFSM2001. |
| (c) Part of the Commonwealth Government grants paid to State Goverments are onpassed to Local Governments. |
| (d) The multi-jurisdictional sector contains units where jurisdiction is shared between two or more governments, or where classification of a unit to a jurisdiction is otherwise unclear. The main type of units currently falling into this category are the public universities. |
| (e) The sum of taxation revenue for all levels of government does not equal the sum of adjusted taxation revenue for all levels of government owing to grants paid to the multi-jurisdictional sector. |
Adjusted total revenue, and adjusted total revenue less transfers to households
Table 2 below shows adjusted total revenue, and adjusted total revenue less transfers to households for all three levels of government.
TABLE 2. ADJUSTED TOTAL REVENUE, less transfers to households |
|
 | 2003-04 | 2004-05 | 2005-06 | 2006-07 | 2007-08 | 2008-09 |
 | $m | $m | $m | $m | $m | $m |
Commonwealth |
|
| 1. Adjusted taxation revenue(a) | 150 620 | 166 427 | 178 193 | 192 470 | 208 756 | 198 178 |
| 2. Non-taxation revenue(b) | 12 474 | 12 865 | 15 563 | 15 990 | 17 619 | 20 281 |
| 3. Adjusted total revenue =1+2 | 163 094 | 179 292 | 193 756 | 208 460 | 226 375 | 218 459 |
| As % of GDP (f) | 18.9 | 19.4 | 19.4 | 19.1 | 19.2 | 17.4 |
| 4. Direct benefits to households(c) | 71 897 | 73 989 | 76 997 | 81 138 | 86 078 | 111 548 |
| 5. Indirect benefits to households(d) | 19 590 | 22 164 | 22 789 | 25 090 | 27 606 | 30 767 |
| 6. Adjusted total revenue, less transfers to households =3-4-5 | 71 607 | 83 139 | 93 970 | 102 233 | 112 690 | 76 144 |
| As % of GDP (f) | 8.3 | 9.0 | 9.4 | 9.4 | 9.5 | 6.0 |
State |
|
| 1. Adjusted taxation revenue(a) | 92 104 | 97 075 | 103 337 | 110 282 | 119 943 | 120 001 |
| 2. Non-taxation revenue, excluding current grants from Commonwealth government(b) | 29 888 | 32 701 | 36 748 | 41 006 | 38 643 | 50 355 |
| 3. Adjusted total revenue =1+2 | 121 991 | 129 776 | 140 084 | 151 288 | 158 587 | 170 356 |
| As % of GDP (f) | 14.1 | 14.0 | 14.0 | 13.9 | 13.4 | 13.5 |
| 4. Direct benefits to households(c) | 791 | 1 099 | 994 | 1 046 | 1 350 | 1 687 |
| 5. Indirect benefits to households(d) | 2 081 | 2 002 | 2 338 | 2 389 | 2 516 | 2 751 |
| 6. Adjusted total revenue, less transfers to households = 3-4-5 | 119 120 | 126 675 | 136 752 | 147 853 | 154 721 | 165 919 |
| As % of GDP (f) | 13.8 | 13.7 | 13.7 | 13.5 | 13.1 | 13.2 |
Local |
|
| 1. Adjusted taxation revenue(a) | 9 864 | 10 258 | 10 813 | 11 644 | 12 555 | 14 173 |
| 2. Non-taxation revenue, excluding current grants from Commonwealth and state governments(b) | 10 069 | 11 004 | 13 042 | 14 370 | 15 203 | 16 358 |
| 3. Adjusted total revenue =1+2 | 19 933 | 21 261 | 23 854 | 26 014 | 27 758 | 30 531 |
| As % of GDP (f) | 2.3 | 2.3 | 2.4 | 2.4 | 2.3 | 2.4 |
| 4. Direct and indirect benefits to households(e) | . . | . . | . . | . . | . . | . . |
| 5. Adjusted total revenue, less transfers to households = 3-4 | 19 933 | 21 261 | 23 854 | 26 014 | 27 758 | 30 531 |
| As % of GDP (f) | 2.3 | 2.3 | 2.4 | 2.4 | 2.3 | 2.4 |
|
| . . not applicable |
| (a) Derived in Table 1. |
| (b) Non-taxation revenue includes revenue from sales of goods and services, interest income, other property income (such as dividends, income tax equivalents, land rents and royalties), fines, capital revenue, and all current revenue other than grants. |
| (c) Direct benefits to households are monetary transfers. |
| (d) Indirect benefits to households are transfers 'in-kind' via goods and services. |
(e) Local government does not make transfers of this kind to households.
(f) As published in Australian National Accounts, December Quarter 2009 (Cat. no. 5206.0), Table 43 of the PDF, Expenditure on GDP, Current Prices: Annual. |
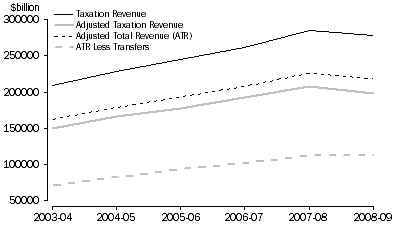
After peaking in 2007-08, Commonwealth government taxation revenues decreased for all four measures in 2008-09 (Graph 1). Commonwealth taxation revenue collected fell to $278,002 million, a decrease of 2.7% from the previous year. When taxation revenue distributed by the Commonwealth Government to both state and local government by way of current grants is taken into account, the level of adjusted taxation revenue at the Commonwealth Government's disposal in 2008-09 was $198,178 milion. This represents a 5.1% decrease from the previous year. Adjusted taxation revenue for the Commonwealth Government was 58.5% of total taxation revenue in Australia in 2008-09.
Adjusted total revenue for the Commonwealth Government in 2008-09 was $218,459 million, down 3.5% from the previous year.
When direct and indirect transfers to households are taken into account, Commonwealth Government revenue fell to $76,144 million in 2008-09. This is largely because of the income redistribution role performed by the Commonwealth Government through welfare payments. In 2008-09, the Commonwealth Government's adjusted total revenue less transfers to households fell by 32.4%.
As a proportion of GDP, Commonwealth adjusted total revenue less transfers to households decreased from 9.5% in 2007-08 to 6.0% in 2008-09.
Graph 1 : Commonwealth Taxation Revenues

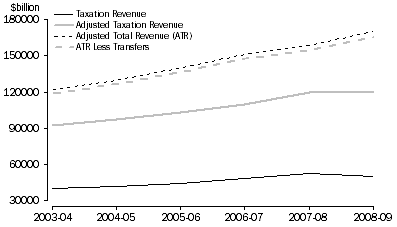
As shown below in Graph 2, state government taxation revenues increased each year for all four measures between 2003-04 and 2007-08. In 2008-09 state government taxation revenue was $50,627 million, a decrease of 4.7% over the previous year. When grants paid by the Commonwealth Government to state government are taken into account, state government adjusted taxation revenue in 2008-09 is $120,001 million (up 58 million). Adjusted taxation revenue at the state level of government was 35.4% of total taxation revenue in 2008-09, compared with 34.4% in 2007-08.
For the state governments, adjusted total revenue in 2008-09 was $170,356 million, an increase of 7.4%.
When direct and indirect transfers to households by state governments are taken into account, state government revenue was $165,919 million in 2008-09. The redistribution of grants to state governments plus the net impact of transfer payments result in state government adjusted total revenue less transfers to households ($165,919 million) exceeding the Commonwealth Government's adjusted total revenue less transfers to households ($76,144 million).
Adjusted total revenue less transfers to households decreased to 13.2% of GDP in 2008-09, compared to 13.8% in 2003-04.
Graph 2: State Taxation Revenues

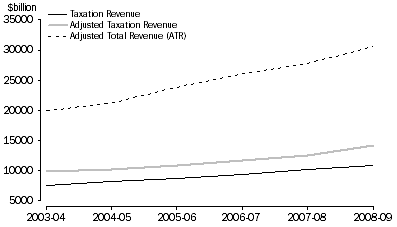
Local government taxation revenues have increased each year for all three measures since 2003-04 (Graph 3). Taxation revenue collected was $10,874 million in 2008-09, an increase of 7.4% from the previous year. In 2008-09, adjusted taxation revenue increased 12.9% (up $1,618 million) and adjusted total revenue for local government increased 10.0% (up $2,773 million). Non-taxation revenue as a share of adjusted total revenue for local government increased steadily from 2003-04 to 2006-07. In 2008-09 it represented 53.5% of adjusted total revenue.
Graph 3 : Local Taxation Revenues

 Print Page
 Print All
 Quality Declaration