Australian Health Survey: Usual Nutrient Intakes

Latest release

Provides a distributional analysis of usual nutrient consumption enabling population assessment of intakes against the Nutrient Reference Values

Reference period
2011-12 financial year
Released
6/03/2015
Next release Unknown
First release

Preface

Logos of the Australian Bureau of Statistics (ABS) and Food Standards Australia New Zealand (FSANZ)

This publication is the second release of nutrition results from the 2011-13 Australian Health Survey (AHS). It presents national level information on the usual intake of selected nutrients by the Australian population. Information collected in the 2011-13 AHS about the population's eating patterns has been modelled to enable estimates of the proportions of the population with excessive, adequate and inadequate nutrient intakes to be determined. The information in this publication is intended to complement the first release of 2011-13 AHS nutrition results which included average intakes of foods and nutrients.

This publication was jointly prepared and released by the Australian Bureau of Statistics (ABS) and Food Standards Australia New Zealand (FSANZ).

David W. Kalisch
Australian Statistician


Signature of Australian Statistician David W. Kalisch

Key findings

This publication is the second release of nutrition data from the 2011-12 National Nutrition and Physical Activity Survey (NNPAS). It presents a comparison of usual intakes of nutrients from foods with the current Nutrient Reference Values (NRVs) for Australia and New Zealand. The NRVs are a set of recommendations made by the Australian National Health and Medical Research Council and the New Zealand Ministry of Health for nutritional intake, based on currently available scientific knowledge.¹

Usual nutrient intakes are an estimate of what people ‘usually’ eat, as opposed to what they reported eating on the particular days they were surveyed in the 2011-12 NNPAS. As NRVs are set on the basis of long term (i.e. usual) nutrient requirements, usual nutrient intakes have been used for comparison in this publication.

Key results

  • Nearly three quarters of females (73%) and half of all males (51%) aged two years and over did not meet their calcium requirements based on their intakes from food.
  • Females were much more likely to have inadequate iron intakes from foods than males, with one in four (23%) not meeting their requirements compared with one in thirty males (3%).
  • Three in four males (76%) and two in five females (42%) aged two years and over exceeded the Upper Level of Intake (UL) for sodium (this does not include sodium added at the table or during cooking).
  • Almost all Australians met their nutritional needs for protein, vitamin C, vitamin B12, phosphorus and selenium. For each of these nutrients approximately 95% or more of all males and females had an adequate usual intake. 95% or more of males also met their requirements for folate, iodine and iron.
  • Almost all (approximately 95% or more) 2-3 year olds met their requirements for all nutrients except iron.
  • Almost all (approximately 95% or more) 4-8 year olds met their requirements for all nutrients except calcium and iron.
     

Focus on folates, thiamin and iodine

In Australia, most wheat flour for bread making is required to be fortified (enriched) with folic acid (a form of folate) and thiamin. If salt is used in bread making it is required to be iodised for the majority of bread types.²

  • Approximately one in twelve (9%) adult females (aged 19 and over) did not meet their requirements for folate (dietary folate equivalents) based on their intakes from foods.
  • Approximately 7% of males and 16% of females had inadequate thiamin intakes. This was consistently higher for females than for males across all age groups over 19 years.
  • 2% of males and 8% of females did not meet their iodine requirements.
  • Some young children exceeded the UL for iodine (13% of males and 6% of females aged 2-3 years).
     

Differences across ages

  • Males aged 71 years and over were less likely than younger males to meet their requirements for protein, riboflavin, vitamin B6, calcium, selenium and zinc. Around one in seven (14%) males aged 71 years and over did not meet their requirements for protein.
  • Females aged 71 years and over were less likely than younger females to meet their requirements for protein, riboflavin and vitamin B6.
  • Young children were more likely than older age groups to exceed the ULs for zinc and iodine.
     

Endnotes

  1. National Health and Medical Research Council and New Zealand Ministry of Health, 2006, Nutrient Reference Values for Australia and New Zealand, http://www.nrv.gov.au/nutrients, last accessed 4/2/2015
  2. Food Standards Australia New Zealand, 2013, Australia New Zealand Food Standards Code, http://www.foodstandards.gov.au/code/Pages/default.aspx, last accessed 13/2/2015

In this release

This publication is the second release of nutrition results from the 2011-13 Australian Health Survey (AHS). It is intended to complement the first release of nutrition information relating to intakes of foods and nutrients reported for the first day of the survey and the results of biomedical tests of nutrient status.

This publication presents national level information on usual intake of selected nutrients from foods. Information is presented by population characteristics (age and sex). Other population characteristics may be relevant to these results, but have not been included in this publication.

Usual nutrient intakes

Usual intakes are an estimate of what people ‘usually’ eat, as opposed to what they reported eating on the particular days they were surveyed. Usual intakes of nutrients in the Australian population (aged two years and over) are presented here, based on the results of a mathematical statistical model (the National Cancer Institute (NCI) method) applied to the two days of reported dietary intakes from the 2011-12 National Nutrition and Physical Activity Survey (NNPAS), a component of the 2011-13 AHS. This model uses the two days of dietary intake data for all people in an age and sex group to estimate the distribution of long-term or usual intakes for that age and sex group. The method is used to produce group usual intake distributions, not usual intakes of individuals in the nutrition survey. In most cases, the group mean usual intake will be similar to the group mean for a single day intake. However, usual intake information, derived from two days of dietary intake data, gives a more accurate estimate of the proportion of people whose intake of a nutrient is above or below the guideline value for their age and sex. The distribution of usual intakes gives a picture of how much people vary in what they usually eat, within a group. Information on this distribution is presented as percentiles of usual nutrient intakes in Excel data cubes via the Data downloads section.

In this publication, usual nutrient intakes have been estimated based on food consumption, and do not include the contribution of supplements to nutrient intakes. For information on consumption of supplements in the 2011-12 NNPAS, see the Nutrition First Results: Supplements.

Comparisons with guidelines

In this publication, usual nutrient intakes are compared with Nutrient Reference Values(NRVs) for each age and sex group. The proportion of people consuming less than the Estimated Average Requirement (EAR) for each nutrient, where relevant, is presented. The proportion of a group that has usual nutrient intakes below that group’s EAR is taken to be the prevalence of inadequacy (i.e. the proportion of the group not meeting their requirements for the nutrient). This method of deriving the prevalence of inadequacy is referred to as the ‘EAR cut-point’ method. The exception to this is iron where a different method of calculating the prevalence of inadequate intakes (the full probability method) must be used, due to the way in which iron requirements vary within age and sex groups.¹ Comparisons with EARs are presented for the following nutrients: protein, vitamin A (retinol equivalents), thiamin (vitamin B1), riboflavin (vitamin B2), niacin equivalents (vitamin B3), vitamin B6, vitamin B12, dietary folate equivalents, vitamin C, calcium, iodine, iron, magnesium, phosphorus, selenium and zinc. For more information on the use of nutrient reference values to measure the prevalence of inadequate intakes for groups of people, see Chapter 4 of Dietary Reference Intakes: Applications in Dietary Assessment, 2000.

Inadequate intakes of specific nutrients will have different effects on health within different age and sex groups. For example, if children and adolescents have inadequate intakes of calcium it reduces their ability to develop strong, healthy bones. In general, inadequate intake of a nutrient is likely to increase the risk of adverse health effects, by negatively affecting the normal functions of the body. More information on the scientific basis for the NRVs and likely health effects of not meeting requirements for each nutrient is available at Nutrient Reference Values.

Usual nutrient intakes of an age-sex group are also compared with the Upper Level of Intake (UL) for that group, where relevant. The proportion of the group with a usual intake of a nutrient above the UL is the proportion of the group that is at risk of adverse effects from excess intake. Comparisons with ULs are presented for the following nutrients: calcium, iodine, iron, phosphorus, selenium, zinc, preformed vitamin A (retinol), folic acid, vitamin E, sodium and long-chain omega 3 fatty acids. Note that the proportions exceeding the UL could potentially be underestimates for some nutrients, as they do not include the contribution from dietary supplements.

When usual nutrient intakes are close to the EAR or UL, it does not imply an adverse effect will occur. However, as usual nutrient intakes become more extreme (i.e. further below the EAR or further above the UL) then the risk of an adverse effect occurring will increase.

Although there are no applicable EARs or ULs, usual intakes for some other nutrients included in the 2011-12 NNPAS are also available in the data cubes of this publication (pro vitamin A, natural folate, vitamin E, potassium, caffeine, total fat, saturated fat, monounsaturated fat, polyunsaturated fat, linoleic acid, alpha-linolenic acid, trans fatty acids, cholesterol, carbohydrate, total sugars, dietary fibre, moisture, alcohol and caffeine).

Data quality

The accuracy of estimated usual nutrient intakes in this publication will be influenced by both the quality of the reported dietary intakes in the underlying dataset (the 2011-12 NNPAS), and the accuracy of the modelling process. Sampling errors in the tables do not measure all forms of error that may occur in this data, although every effort is made to minimise these other sources of error (including prediction and simulation error from the use of a model, and any non-sampling errors in the original collection of the dietary intake information). Where comparisons with guideline values (Nutrient Reference Values or NRVs) have been made, any results outside of these guideline values need to be considered along with how the guideline values were established in order to appropriately interpret the resulting estimates. Information on interpreting the sampling error tables in this publication and other potential sources of error is available in the Data quality of the Users’ Guide. Analysis of the 2011-12 NNPAS suggests that, like other nutrition surveys, there has been some under-reporting of food intake by participants in this survey. Given the association of under-reporting with overweight/obesity and consciousness of socially acceptable/desirable dietary patterns, under-reporting is unlikely to affect all foods and nutrients equally. For more information on under-reporting in this survey, see Under-reporting in Nutrition Surveys in the Users’ Guide.

For more information on the way in which these usual nutrient intakes have been calculated using the NCI method, the approach used in comparing usual nutrient intakes with NRVs, and the population groups to whom these results apply, see Usual Nutrient Intakes in the Users’ Guide.

The Australian Bureau of Statistics and Food Standards Australia New Zealand have taken great care to ensure the information in this publication is as correct and accurate as possible. However, the Australian Bureau of Statistics and Food Standards Australia New Zealand do not guarantee, and accepts no legal liability whatsoever arising from, or connected to, the use of any material contained in this publication. It is recommended that users exercise their own skill and care with respect to their use of information in this publication, and that users carefully evaluate the accuracy, currency, completeness and relevance of the material for their purposes

Endnotes

  1. Food and Nutrition Board: Institute of Medicine, 2000, Dietary Reference Intakes: Applications in dietary assessment, National Academy Press, Washington, D.C., p. 80

Macronutrients

This section contains information about usual intakes of protein, carbohydrate (specifically total sugars) and fat, and information on the prevalence of inadequate intakes of protein (based on the EAR). There are no EARs for other macronutrients.

In addition to measuring total macronutrient intake (by the EAR), the balance of macronutrients in the diet is also assessed using the Acceptable Macronutrient Distribution Range (AMDR). Although both an EAR and an AMDR apply to protein, the results of comparison with the EAR and the AMDR are interpreted differently. Comparisons with AMDRs are available at Acceptable Maconutrient Distribution Ranges.

Protein

Inadequate intakes of protein (based on the EAR) indicate insufficient intake of protein to support the body’s normal tissue maintenance and/or growth, potentially leading to protein energy malnutrition.

Animal and plant foods provide protein, including meat, poultry, fish and seafood, eggs, tofu, legumes, beans, nuts and seeds.¹ EARs have been set for protein based on the minimum amounts needed for the body to maintain itself and to allow for normal growth. Almost all Australians (99%) met their requirements for protein based on the EAR. However, approximately one in seven males (14%) and one in twenty-five females (4%) aged 71 years and over did not meet their requirements for protein.²

Carbohydrates

Carbohydrates, comprising mainly of sugars and starch, produce energy for the body to use, and are especially important for brain function. Carbohydrates usually provide the major part of energy in human diets.

Sugars are naturally present in foods such as fruit and milk products as well as added to a range of processed foods and beverages.³ In the NNPAS, naturally occurring sugars cannot be differentiated from those that are added (see AUSNUT 2011-13 for more information on the measurement of sugar in this data).

The top 25% of the population had a usual intake of at least 100 grams of total sugars per day. This is equivalent to at least 23 teaspoons of naturally present or added sugars. Some examples of foods that have 100 grams of naturally present or added sugars are:

  • three cans of soft drink OR
  • two medium sized banana cupcakes OR
  • five apples.
     

Mean and median usual intake of total sugars was higher among adolescents (aged 9-18 years) than adults over 30 years of age. Overall, males had higher mean and median usual intakes of total sugars compared with females across most age groups.

Fat

Fat has the highest energy density of the macronutrients. In addition to being a concentrated form of energy, fats help the body absorb fat-soluble vitamins, such as vitamin A. Dietary fats may be saturated, monounsaturated, or polyunsaturated, depending on their chemical structure. In general, saturated fats are found in animal-based foods, while monounsaturated and polyunsaturated fats are found in plant-based foods, although there are exceptions.¹

Males aged 9 to 50 years had a median usual intake of total fats ranging from 79 to 89 grams per day. The top 25% of the male population aged 9 to 50 years had a usual intake of at least 94 grams of total fats per day. This is equivalent to the following foods:

  • 7 tablespoons of spreads such as butter, margarine and dairy blend.
  • 5 tablespoons of oil.
     

Females aged 9 to 50 years had a lower median usual intake of total fats than males (ranging from 64 to 69 grams per day). The top 25% of the female population aged 9 to 50 years had a usual intake of at least 76 grams of total fats per day. This is equivalent to the following foods:

  • 6 tablespoons of spreads such as butter, margarine and dairy blend.
  • 4 tablespoons of oil.
     

Endnotes

  1. National Health and Medical Research Council and New Zealand Ministry of Health, 2006, Nutrient Reference Values for Australia and New Zealand, http://www.nrv.gov.au/nutrients, last accessed 4/2/2015
  2. This figure does not include residents of aged-care facilities, hospitals, or other non-private dwellings. For more information on the scope of this survey please see the Scope chapter of the AHS: Users' Guide, 2011-13 (cat. no. 4363.0.55.001).
  3. National Health and Medical Research Council, 2013, Australian Dietary Guidelines. Canberra: National Health and Medical Research Council, https://www.nhmrc.gov.au/about-us/publications/australian-dietary-guidelines, last accessed 4/2/2015

Acceptable Macronutrient Distribution Ranges

Dietary energy is derived from the macronutrient content of foods. The energy-yielding macronutrients are: protein, fat, carbohydrate and alcohol, with small amounts of additional energy provided by dietary fibre and organic acids.

Imbalances in the proportion of energy derived from macronutrients are associated with increased risk of chronic diseases. Reference ranges known as Acceptable Macronutrient Distribution Ranges (AMDR) form part of the recommendations for optimising the balance of intake of each of the macronutrients to lower chronic disease risk while allowing for adequate micronutrient intakes. AMDRs are set for healthy people who are maintaining their body weight, and are not necessarily appropriate for weight loss or the management of specific health conditions. Usual intakes outside of the AMDR indicate imbalance in the contribution of energy from each of the macronutrients, and an increased risk of chronic disease over time.

Proportion of energy from macronutrients - Acceptable Macronutrient Distribution Range (AMDR)

 Lower limit of AMDR (%) (a)Upper limit of AMDR (%) (a)
Carbohydrate4565
Fat2035
Protein1525

Source:
a. National Health and Medical Research Council and New Zealand Ministry of Health, Nutrient Reference Values for Australia and New Zealand, 2006 https://www.nrv.gov.au/chronic-disease/macronutrient-balance


Approximately half of all Australians aged two years and over (51%) had a usual intake of carbohydrate as a proportion of total energy below the lower limit of the AMDR. More than two in three 51-70 year olds (70% of males and 68% of females) had an intake less than this lower limit of energy from carbohydrate. Almost no Australians (0.1%) aged two years and over had a usual intake of carbohydrates as a proportion of total energy above the upper limit of the AMDR.

Approximately one in eight males (13%) and one in six females (16%) had a usual intake of fat above the upper end of the recommended range of the proportion of total energy from fat. Amongst 14-18 year-olds, approximately one in five (22% of females and 19% of males) exceeded the upper boundary of the AMDR for the proportion of total energy from fat.

Approximately one in three children (30% of males and 33% of females) aged 2-18 years had a usual intake less than the lower end of the recommended intake of protein as a proportion of total energy, compared with approximately one in eight adults (13% of males and 11% of females).

Alcohol

Alcohol is a relatively energy-dense macronutrient and therefore can also contribute to dietary energy. There is no AMDR for alcohol. In terms of macronutrient balance, the general recommendation is that energy from alcohol should contribute less than 5% of total energy.¹

Based on usual intakes, nearly half of all males (47%) and approximately one in three females (30%) aged 51-70 years consumed more than 5% of total energy from alcohol. Approximately one quarter of males (23%) aged 19-30 years consumed over 5% of total energy from alcohol.

Endnotes

  1. National Health and Medical Research Council and New Zealand Ministry of Health, 2006, Nutrient Reference Values for Australia and New Zealand, https://www.nrv.gov.au/chronic-disease/macronutrient-balance, last accessed 4/2/2015

Vitamins

Vitamins are chemical compounds essential to the proper functioning of the human body. They need to be obtained through diet as the body is unable to make them on its own. If they are not consumed for a period of time, deficiency symptoms may develop.

Vitamin A

Vitamin A helps normal immune function, vision, and reproduction.¹ Vegetable products and dishes are the largest contributors to vitamin A intake in Australia followed by milk products.²

Approximately 17% of males and 14% of females had inadequate usual intakes of vitamin A (as retinol equivalents). For 14-18 year olds, 33% of males and 27% of females did not meet requirements, along with 21% of males and 20% of females aged 19-30 years.

Proportion of population with inadequate vitamin A intakes (estimated as % below the EAR), by age

Age (years)EAR (µg)(a) Prevalence of inadequacy (%) 
 MalesFemalesMalesFemales
2-32102100.72.1
4-82752752.45.9
9-134454204.58.9
14-18630485#33.226.5
19-3062550020.619.9
31-5062550019.215.0
51-7062550016.911.3
71 and over62550013.215.7

Source:
a. National Health and Medical Research Council and New Zealand Ministry of Health, 2006, Nutrient Reference Values for Australia and New Zealand, http://www.nrv.gov.au/nutrients/vitamin-a

# proportion has a margin of error >10 percentage points which should be considered when using this information.


Less than 5% of the population exceeded the UL for preformed vitamin A (retinol).

Endnotes

  1. National Health and Medical Research Council and New Zealand Ministry of Health, 2006, Nutrient Reference Values for Australia and New Zealand, http://www.nrv.gov.au/nutrients/vitamin-a, last accessed 4/2/2015
  2. Australian Bureau of Statistics, 2014, Australian Health Survey: Nutrition First Results - Foods and Nutrients, 2011-12, 'Table 10: Proportion of Nutrients from food groups', data cube: Excel spreadsheet, cat. no. 4364.0.55.007

Thiamin

Thiamin (or vitamin B1) helps the body convert food into energy for the brain, nervous system and muscles. Thiamin is found in small quantities in a range of foods, but the main source is cereal foods.¹ In Australia most wheat flour for bread making is fortified (enriched) with thiamin.²


Approximately 7% of males and 16% of females had usual intakes of thiamin below their requirements. The proportion of persons with a usual intake not meeting their requirement was consistently higher for females aged 19 and over than for males, despite females in this age group having a lower EAR than males (0.9 mg/day and 1.0 mg/day respectively). This is consistent with Nutrition First Results – Food and Nutrients, 2011-12, where males had a higher consumption of thiamin rich cereals and cereal products.³

Endnotes

  1. Australian Bureau of Statistics, 2014, Australian Health Survey: Nutrition First Results - Foods and Nutrients, 2011-12, 'Table 10: Proportion of Nutrients from food groups', data cube: Excel spreadsheet, cat. no. 4364.0.55.007
  2. National Health and Medical Research Council and New Zealand Ministry of Health, 2006, Nutrient Reference Values for Australia and New Zealand, http://www.nrv.gov.au/nutrients/thiamin, last accessed 4/2/2015
  3. Australian Bureau of Statistics, 2014, Australian Health Survey: Nutrition First Results - Foods and Nutrients, 2011-12, 'Table 5: Mean daily food intake', data cube: Excel spreadsheet, cat. no. 4364.0.55.007

Riboflavin

Riboflavin (or vitamin B2) is important for activating (or converting) other nutrients into forms that can be used by the body (bioactive forms).¹ Milk and milk products are the primary source of riboflavin in the Australian diet, followed by cereal and cereal products,² some of which are fortified.

6% of males and 8% of females aged two years and over had inadequate intakes of riboflavin. Persons aged 71 years and over have a higher requirement for riboflavin,¹ and both males and females aged 71 and over were much less likely to meet the requirements (20% with inadequate intakes) than younger age groups (up to 9% with inadequate intakes). Almost all males and females up to 13 years of age met their riboflavin requirements.

Proportion of population with inadequate riboflavin (B2) intakes (estimated as % below the EAR), by age

Age (years)EAR (mg)(a) Prevalence of inadequacy (%) 
 MalesFemalesMalesFemales
2-30.40.4--
4-80.50.5--
9-130.80.81.02.9
14-181.10.94.68.4
19-301.10.93.47.7
31-501.10.94.47.8
51-701.10.98.78.1
71 and over1.31.120.320.3

Source:
a. National Health and Medical Research Council and New Zealand Ministry of Health, 2006, Nutrient Reference Values for Australia and New Zealand, http://www.nrv.gov.au/nutrients/riboflavin, last accessed 4/2/2015

- nil or rounded to zero (including null cells)


Endnotes

  1. National Health and Medical Research Council and New Zealand Ministry of Health, 2006, Nutrient Reference Values for Australia and New Zealand, http://www.nrv.gov.au/nutrients/riboflavin, last accessed 4/2/2015
  2. Australian Bureau of Statistics, 2014, Australian Health Survey: Nutrition First Results - Foods and Nutrients, 2011-12, 'Table 10: Proportion of Nutrients from food groups', data cube: Excel spreadsheet, cat. no. 4364.0.55.007

Vitamin B6

Vitamin B6 is required for the metabolism of amino acids and other compounds. Meat, poultry and game products and dishes are the major dietary source of vitamin B6, while vegetable products and dishes, milk products and dishes, fortified drinks, cereals and cereal based products are also dietary sources.¹

Three in every ten people aged two years and over had an inadequate intake of vitamin B6. In general, females were twice as likely as males to have an inadequate intake of vitamin B6 (41% compared with 18%). Overall, adults were more likely than children to have an inadequate intake of vitamin B6, with 21% of males and 48% of females aged 19 years and over not meeting their requirements, compared with 8% of males and 17% of females aged 2-18 years.

Females’ usual intakes of vitamin B6 were lower than males’, which is consistent with their lower mean daily consumption of meat and meat products.²

Proportion of population with inadequate vitamin B6 intakes (estimated as % below the EAR), by age

Age (years)EAR (mg)(a) Prevalence of inadequacy (%) 
 MalesFemalesMalesFemales
2-30.40.4-0.3
4-80.50.50.11.1
9-130.80.86.820.1
14-181.11.020.3#37.4
19-301.11.14.834.4
31-501.11.18.138.5
51-701.41.338.958.0
71 and over1.41.356.772.1

Source:
a. National Health and Medical Research Council and New Zealand Ministry of Health, 2006, Nutrient Reference Values for Australia and New Zealand, http://www.nrv.gov.au/nutrients/vitamin-b6

- nil or rounded to zero (including null cells) # proportion has a margin of error >10 percentage points which should be considered when using this information.
 

Endnotes

  1. Australian Bureau of Statistics, 2014, Australian Health Survey: Nutrition First Results - Foods and Nutrients, 2011-12, 'Table 10: Proportion of Nutrients from food groups', data cube: Excel spreadsheet, cat. no. 4364.0.55.007
  2. Australian Bureau of Statistics, 2014, Australian Health Survey: Nutrition First Results - Foods and Nutrients, 2011-12, 'Table 5: Mean daily food intake', data cube: Excel spreadsheet, cat. no. 4364.0.55.007

Folate

Folate is a B group vitamin that is essential for healthy growth and development. Folate is found in foods such as green leafy vegetables, fruits and grains.¹ Cereals and cereal products, many of which are fortified, are a major contributor in the Australian diet.²

Proportion of population with inadequate dietary folate equivalents intakes (estimated as % below the EAR), by age

Age (years)EAR (µg)(a)Prevalence of inadequacy (%) 
  MalesFemales
2-3120--
4-8160--
9-132500.41.2
14-183301.27.9
19-303202.810.9
31-503202.310.6
51-703202.57.6
71 and over3201.66.1

Source:
a. National Health and Medical Research Council and New Zealand Ministry of Health, 2006, Nutrient Reference Values for Australia and New Zealand, http://www.nrv.gov.au/nutrients/folate, last accessed 4/2/2015

- nil or rounded to zero (including null cells)


Folic acid is the form of folate used in dietary supplements and for food fortification, as it is more stable than the naturally-occurring forms in foods.¹ Mandatory fortification of wheat flour for bread making flour with folic acid was introduced in Australia in 2009 to help reduce the incidence of neural tube defects (NTDs) in babies, including spina bifida. Given the critical importance of folate in early growth and development, it is recommended that all women of childbearing age, even if they are not planning on becoming pregnant, also take extra folic acid.³ Dietary folate equivalents are used to measure folate intakes to account for the differing bioavailability of natural folate and folic acid.

Approximately one in eleven (9%) adult females (aged 19 and over) did not meet their requirements for folate (as dietary folate equivalents). Almost all males met their requirements for folate (2% with inadequate intakes).

The 2011–12 National Health Measures Survey (NHMS) included tests for folate. The NHMS showed that the vast majority of women of childbearing age had sufficient folate levels in 2011–12 based on their blood tests. Less than 1% had a red cell folate level which indicates an increased risk of NTDs and no women aged 16–44 years were in the range for high risk of NTDs (<453 nmol/L). For more information on folate levels of women of childbearing age see the Feature Article: Women of Childbearing Age from the NHMS. In making comparisons between the NHMS and the usual nutrient intakes, consideration should be given to the differences in the methods used to measure the prevalence of inadequate folate intakes, including the potential contribution of folic acid in dietary supplements to the results of the NHMS.

Less than 5% of the population exceeded the UL for folic acid.

Endnotes

  1. National Health and Medical Research Council and New Zealand Ministry of Health, 2006, Nutrient Reference Values for Australia and New Zealand, http://www.nrv.gov.au/nutrients/folate, last accessed 4/2/2015
  2. Australian Bureau of Statistics, 2014, Australian Health Survey: Nutrition First Results - Foods and Nutrients, 2011-12, 'Table 10: Proportion of Nutrients from food groups', data cube: Excel spreadsheet, cat. no. 4364.0.55.007
  3. World Health Organization, Daily iron and folic acid supplementation in pregnant women, 2012, http://www.who.int/nutrition/publications/micronutrients/guidelines/daily_ifa_supp_pregnant_women/en/index.html, last accessed 4/2/2015

Vitamin B12

Vitamin B12 has a key role in the normal functioning of the brain and nervous system, and for the formation of blood. It helps keep the body's nerve and blood cells healthy and helps make DNA. Almost all vitamin B12 comes from animal foods, such as meat and dairy products.¹,²

The proportion of females aged 14 years and over with inadequate usual intakes of vitamin B12 ranged from 5 to 8% for different age groups. The proportion of corresponding males was below 1%. This is consistent with Nutrition First Results – Food and Nutrients, 2011-12, that showed males consumed more meat than females.

For information on relevant biomedical results for women of childbearing age, see Feature Article: Women of Childbearing Age.

Endnotes

  1. National Health and Medical Research Council and New Zealand Ministry of Health, 2006, Nutrient Reference Values for Australia and New Zealand, https://www.nrv.gov.au/nutrients/vitamin-b12, last accessed 4/2/2015
  2. Australian Bureau of Statistics, 2014, Australian Health Survey: Nutrition First Results - Foods and Nutrients, 2011-12, 'Table 10: Proportion of Nutrients from food groups', data cube: Excel spreadsheet, cat. no. 4364.0.55.007

Other vitamins

Remaining vitamins with an applicable Estimated Average Requirement (EAR) include niacin equivalents and vitamin C. Less than 5% of the population had inadequate intake of these nutrients based on the EAR.

Less than 5% of the population exceeded the UL for vitamin E.

Essential minerals

Minerals are chemical elements required for a very wide variety of functions including cell function, muscle function, bone formation, hormone production and fluid balance. Some minerals are essential for health and are classified into major and trace elements according to the quantity required by the body.

Calcium

Calcium is a mineral required for the growth and maintenance of bones and teeth, as well as proper functioning of the muscular and cardiovascular systems. Milk and milk-based foods are the richest sources of calcium in the Australian diet, although it is also found in other products.¹ Calcium requirements are higher for adolescents undergoing bone mass growth. Bone mass stabilises for adults, until deteriorating after about age 50 for men and after menopause for women. Low calcium intake is linked to osteoporosis, a low bone density condition particularly affecting post-menopausal women.²f

Proportion of population with inadequate calcium intakes (estimated as % below the EAR), by age

Age (years)EAR (mg)(a) Prevalence of inadequacy (%) 
 MalesFemalesMalesFemales
2-33603600.72.4
4-852052011.020.8
9-11800800#45.5#54.1
12-1310501050#67.0#84.4
14-181050105071.090.3
19-3084084044.271.3
31-5084084043.267.2
51-70840110063.091.2
71 and over1100110089.594.3

Source:
a. National Health and Medical Research Council and New Zealand Ministry of Health, 2006, Nutrient Reference Values for Australia and New Zealand, http://www.nrv.gov.au/nutrients/calcium, last accessed 22/01/2015

# proportion has a margin of error >10 percentage points which should be considered when using this information.


Over half of the Australian population aged two years and over had inadequate usual intakes of calcium. Males and females have the same requirements (EAR) in all age groups except the 51-70 years. However, the prevalence of inadequate calcium intakes was higher amongst females than males, with almost three in four aged two years and over (73%) not meeting their calcium requirements compared with one in two males of the same age group (51%).

Females aged 12 to 18 years and 51 years and over have higher requirements than other ages, and were most likely (nine in ten) to have inadequate intakes. Similarly, males aged 12-18 years and 51 years and over were more likely to have inadequate intakes. About two in three 12-18 and 51-70 year old males had usual intakes that were below their requirements (67% of 12-13 year olds, 71% of 14-18 year olds and 63% of 51-70 year olds), as did 90% of males aged 71 years and over.

Children aged 2-3 years were much more likely to meet their calcium requirements (1% of males and 2% of females with usual intakes below their requirements). This is likely to be a result of lower requirements for calcium and higher consumption of milk products amongst children aged 2-3 years (dairy foods being a rich source of calcium).³


These results do not consider the contribution of dietary supplements to calcium intakes. In the 2011-12 NNPAS, 21% of females had some intake of calcium from dietary supplements on a given day (9% of 2-18 year olds, 21% of 19-50 year olds and 28% of those aged 51 years and over). For males, 14% consumed some supplemental calcium (9% of 2-18 year olds, 15% of 19-50 year olds and 15% of those aged 51 years and over). The amount of calcium that was present in these supplements varied. A future ABS feature article will provide further information on intakes of supplemental calcium in the 2011-12 NNPAS.

Less than 5% of the population exceeded the UL for calcium.

Endnotes

  1. Australian Bureau of Statistics, 2014, Australian Health Survey: Nutrition First Results - Foods and Nutrients, 2011-12, 'Table 10: Proportion of Nutrients from food groups', data cube: Excel spreadsheet, cat. no. 4364.0.55.007
  2. National Health and Medical Research Council and New Zealand Ministry of Health, 2006, Nutrient Reference Values for Australia and New Zealand, https://www.nrv.gov.au/nutrients/calcium, last accessed 4/2/2015.
  3. National Health and Medical Research Council, 2013, Australian Dietary Guidelines. Canberra: National Health and Medical Research Council, https://www.nhmrc.gov.au/about-us/publications/australian-dietary-guidelines, last accessed 4/2/2015.

Iron

Iron is responsible for transporting oxygen in the blood to tissues throughout the body. It is also involved in the immune system, muscle function and cognitive functioning. Iron is found in a range of food sources, with cereal products, and meat, poultry and game products and dishes being the primary sources in the Australian food supply.¹ Females have greater iron requirements than males in many age groups.²

One in eight people aged two years and over had inadequate usual intakes of iron. Females were more likely than males to have inadequate iron intakes, with 23% not meeting the requirements compared with 3% of males. The prevalence of inadequate intakes was highest amongst females aged 14-50 years, with nearly two in five having inadequate iron intakes (40% of 14-18 year old females and 38% of 19-50 year-old females). These groups also have higher requirements for iron.²


These results do not consider the contribution of dietary supplements to iron intakes. On a given day in 2011-12, 14% of females had some intake of iron from dietary supplements (8% of 2-18 year olds, 17% of 19-50 year olds, and 14% of those aged 51 years and over). For males, 9% consumed some supplemental iron (8% of 2-18 year olds, 10% of 19-50 year olds, and 8% of those aged 51 years and over). The amount of iron that was present in these supplements varied. A future ABS feature article will provide further information on intakes of supplemental iron in the 2011-12 NNPAS.

The 2011-12 National Health Measures Survey (NHMS), a component of the 2011-13 AHS, included tests for ferritin (a measure of iron stores in the body) and anaemia (Feature Article: Anaemia). For more information on ferritin levels for women of childbearing age see Feature Article: Women of Childbearing Age. Overall conclusions about the iron status of the Australian population should take into account the results of the NHMS.

Less than 5% of the population exceeded the UL for iron.

Endnotes

  1. Australian Bureau of Statistics, 2014, Australian Health Survey: Nutrition First Results - Foods and Nutrients, 2011-12, 'Table 10: Proportion of Nutrients from food groups', data cube: Excel spreadsheet, cat. no. 4364.0.55.007
  2. National Health and Medical Research Council and New Zealand Ministry of Health, 2006, Nutrient Reference Values for Australia and New Zealand, https://www.nrv.gov.au/nutrients/iron, last accessed 4/2/2015

Sodium

Sodium occurs in a number of different forms but is generally consumed as sodium chloride (commonly known as 'salt'). Sodium is found naturally in foods such as milk, cream, eggs, meat and shellfish. Sodium is also added to foods to enhance flavours, to act as a preservative and as part of some food additives. Processed foods, such as snack foods, bacon, and condiments, generally have high levels of sodium added during processing. High intakes of sodium can increase blood pressure, and high blood pressure can increase the risk of developing heart and kidney problems.¹

Nearly two in every three people aged two years and over had a usual intake that exceeded the UL for sodium (76% of males and 42% of females). Intakes of sodium were consistently higher for males than females. Males were more likely to exceed the UL than females, a difference that was more pronounced for every age group over nine years. Children were more likely than adults to exceed the UL for sodium, with 91% of males and 74% of females aged 2-18 years compared with 71% of males and 32% of females aged 19 years and over exceeding the UL. This was particularly pronounced amongst children aged 2-8 years with nearly 100% of males and 95% of females exceeding the UL for sodium.


These figures underestimate total sodium intakes, as they are based on sodium naturally present in foods as well as sodium added during processing, but exclude the 'discretionary salt' added by consumers when preparing foods in the home or 'at the table'. Almost two in three (64%)² of Australians reported that they add salt very often or occasionally either during meal preparation or at the table. For more information, see the Interpretation paragraph of Nutrient Intake in the Users' Guide.

Endnotes

  1. National Health and Medical Research Council and New Zealand Ministry of Health, 2006, Nutrient Reference Values for Australia and New Zealand, https://www.nrv.gov.au/nutrients/sodium, last accessed 4/2/2015
  2. Australian Bureau of Statistics, 2014, Australian Health Survey: Nutrition First Results - Foods and Nutrients, 2011-12, 'Sodium', cat. no. 4364.0.55.007

Iodine

Iodine is an essential nutrient required for the production of thyroid hormones, important for normal growth and development, particularly of the brain. The major dietary sources of iodine include bread and milk.¹ Inadequate amounts of iodine may lead to a range of conditions, including goitres, hypothyroidism, and in severe cases, intellectual disability.² Since October 2009, food regulations in Australia require that iodine is added to the salt used for making bread, except for organic bread and bread mixes for making bread at home.³

2% of males and 8% of females aged two years and over had inadequate intakes of iodine. Females aged 19 years and over were more than four times as likely as males to have inadequate intakes. In general, the prevalence of inadequate intake of iodine for Australian adults aged 19 years and over (2% of males and 10% of females) was higher than amongst children aged 2-18 years (0.4% of males and 2% of females).

Overall, these results were consistent with the biomedical test results from the 2011-12 National Measures Health Survey (NHMS), where around 1 in 10 Australian (13%) aged 5 years and over had a median urinary iodine concentration (UIC) less than 50 µg/L. This is within the World Health Organization recommendation of no more than 20% of the population with a UIC less than 50 µg/L. The NHMS results also showed women were more likely to be iodine deficient, with a higher proportion having a UIC less than 50 µg/L(16% compared with 10% of men). The prevalence of iodine deficiency was also lowest among young children (5-11 years), with only 6% having iodine levels under 50 µg/L compared with around 15% of those aged 35–54 years. For more information on iodine biomedical test results, see Feature Article: Iodine. In making comparisons between the NHMS and the usual nutrient intakes, consideration should be given to the differences in the methods used to measure the prevalence of inadequate iodine intakes, including the potential contribution of intakes of iodised discretionary salt to the results of the NHMS.

Almost one in ten children aged 2-3 years (13% of males and 6% of females) had a usual intake from food exceeding the UL for iodine. The proportion exceeding the UL could potentially be higher if the iodine intake from consuming iodised discretionary salt was included, however this could not be quantified from this survey.

Age-specific ULs for iodine are based on data from adults that are extrapolated to children using reference body weights. The UL for iodine is based on sub-clinical hypothyroidism which is an adaptive response of the thyroid to increased levels of iodine and is reversible. In a separate previous evaluation of iodine intake by FSANZ, a detailed toxicological review of the UL was undertaken and FSANZ considered that intakes up to 300 µg/day should be well tolerated by young children., Usual nutrient intakes from this publication were compared with this value of 300 µg/day and it was found that less than 1% of 2-3 year olds (both males and females) exceeded it.

Although it is generally not desirable to exceed a UL, the iodine intakes for young children were below a level at which adverse effects may be observed, though a reduced margin of safety exists.

Proportion of population with inadequate iodine intakes (estimated as % below the EAR), by age

Age (years)EAR (µg)(a)Proportion below EAR (%) 
  MalesFemales
2-3650.10.5
4-8650.10.3
9-13750.30.5
14-18950.86.4
19-301001.511.7
31-501001.69.0
51-701003.510.5
71 and over1004.29.2

Source:
a. National Health and Medical Research Council and New Zealand Ministry of Health, 2006, Nutrient Reference Values for Australia and New Zealand, http://www.nrv.gov.au/nutrients/iodine, last accessed 4/2/2015


For more information on iodine biomedical test results, see Feature article: Iodine.

Endnotes

  1. Australian Bureau of Statistics, 2014, Australian Health Survey: Nutrition First Results - Foods and Nutrients, 2011-12, 'Table 10: Proportion of Nutrients from food groups', data cube: Excel spreadsheet, cat. no. 4364.0.55.007
  2. World Health Organization, UNICEF, ICCIDD, 2007, Assessment of iodine deficiency disorders and monitoring their elimination, http://www.who.int/nutrition/publications/micronutrients/iodine_deficiency/9789241595827/en/, last accessed 5/12/2014
  3. Food Standards Australia New Zealand, 2012, Iodine fortification, http://www.foodstandards.gov.au/consumer/nutrition/iodinefort/Pages/default.aspx, last accessed 05/12/2014
  4. National Health and Medical Research Council and New Zealand Ministry of Health, 2006, Nutrient Reference Values for Australia and New Zealand, https://www.nrv.gov.au/nutrients/iodine, last accessed 4/2/2015
  5. Food Standards Australia New Zealand, 2007, Proposal P1003 Mandatory Iodine Fortification for Australia, Supporting Document 9, Consideration of mandatory fortification with iodine, Safety Assessment and Risk Characterisation Report, December 2007, http://www.foodstandards.gov.au/code/proposals/documents/P1003%20SD9%20-%20Safety%20Assessment.pdf, last accessed 20/2/2015
  6. Food Standards Australia New Zealand, 2008, Proposal P1003, Consideration of Mandatory Fortification with Iodine for Australia and New Zealand, Supporting Document 10, Dietary Intake Assessment Report, Main Report, April 2008, http://www.foodstandards.gov.au/code/proposals/documents/P1003%20SD10%20-%20Dietary%20Intake%20Assessment.pdf, last accessed 20/2/2015
  7. Not available from published tables. Derived from full usual intake distribution.

Phosphorus

Phosphorus is the second most abundant mineral in the body. It plays an important role in the formation of bones and teeth, protein production and energy-producing activities in cells. Phosphorus is widely distributed in foods.¹ Major food sources of phosphorus are foods containing protein such as meat and milk products.²

Proportion of population with inadequate phosphorus intakes (estimated as % below the EAR), by age

Age (years)EAR (µg)(a)Prevalence of inadequacy (%) 
  MalesFemales
2-3380--
4-8405--
9-13105511.727.6
14-1810554.6#29.8
19-30580-0.5
31-50580-0.3
51-70580-0.3
71 and over5800.10.6

Source:
a. National Health and Medical Research Council and New Zealand Ministry of Health, 2006, Nutrient Reference Values for Australia and New Zealand, http://www.nrv.gov.au/nutrients/phosphorus, last accessed 4/2/2015

- nil or rounded to zero (including null cells)
# proportion has a margin of error >10 percentage points which should be considered when using this information.


Around one in thirty people aged two years and over (1% of males and 4% of females) had a usual intake of phosphorus below their requirements. Children aged 9-18 years have the highest requirements for phosphorus at nearly double that of adults, and this age group had the highest proportions with inadequate intakes. Nearly one in three females aged 9-18 years had inadequate intakes of phosphorus (28% of those aged 9-13 years and 30% of those aged 14-18 years). Females aged 2-18 years were three times as likely as males of the same age to not meet their requirements (17% compared with 5%).

Less than 5% of the population exceeded the UL for phosphorus.

Endnotes

  1. National Health and Medical Research Council and New Zealand Ministry of Health, 2006, Nutrient Reference Values for Australia and New Zealand, https://www.nrv.gov.au/nutrients/phosphorus, last accessed 4/2/2015
  2. Australian Bureau of Statistics, 2014, Australian Health Survey: Nutrition First Results - Foods and Nutrients, 2011-12, 'Table 10: Proportion of Nutrients from food groups', data cube: Excel spreadsheet, cat. no. 4364.0.55.007

Magnesium

Magnesium is an essential mineral required for a range of biochemical activities in the human body. These include protein production, muscle and nerve function, blood glucose control and bone development. Magnesium is widely distributed in both animal and plant foods, such as vegetables, fruits and whole grains.¹ Major food sources of magnesium in Australia include cereals and cereal based products and dishes, along with non-alcoholic beverages (such as coffee and water).²

In 2011-12, one in three people aged two years and over (37% of males and 34% of females) did not meet their requirements for magnesium. Inadequate intakes of magnesium were more common in those aged nine years and over, with 61% of males aged 14 to 18 years consuming less than their requirements for magnesium, and 72% of females of the same age. In contrast, almost all children aged 2-8 years met their magnesium requirements. Males aged 19 years and over were more likely than females of the same age group to have inadequate intakes (41% compared with 35%).

Proportion of population with inadequate magnesium intakes (estimated as % below the EAR), by age

Age (years)EAR (mg)(a) Prevalence of inadequacy (%) 
 MalesFemalesMalesFemales
2-36565--
4-8110110-0.3
9-1320020011.824.6
14-1834030061.371.6
19-3033025533.537.2
31-5035026536.432.8
51-7035026546.530.6
71 and over35026563.948.5

Source:
a. National Health and Medical Research Council and New Zealand Ministry of Health, 2006, Nutrient Reference Values for Australia and New Zealand, http://www.nrv.gov.au/nutrients/magnesium

- nil or rounded to zero (including null cells)
 

Endnotes

  1. National Health and Medical Research Council and New Zealand Ministry of Health, 2006, Nutrient Reference Values for Australia and New Zealand, https://www.nrv.gov.au/nutrients/magnesium, last accessed 4/2/2015
  2. Australian Bureau of Statistics, 2014, Australian Health Survey: Nutrition First Results - Foods and Nutrients, 2011-12, 'Table 10: Proportion of Nutrients from food groups', data cube: Excel spreadsheet, cat. no. 4364.0.55.007

Selenium

Selenium functions as an antioxidant and in thyroid metabolism.¹ The main sources of selenium in Australia are meat, poultry and game products and dishes; cereal based products and dishes; cereals and cereal products; and fish and seafood products and dishes.² Soil concentration of selenium ranges widely and affects levels in plant food.¹

3% of males and 6% of females aged two years and over did not meet their requirements for selenium intake. Amongst those 71 years and over, approximately one in ten had inadequate selenium intakes (12% of males and 10% of females).

Less than 5% of the population exceeded the UL for selenium.

Endnotes

  1. National Health and Medical Research Council and New Zealand Ministry of Health, 2006, Nutrient Reference Values for Australia and New Zealand, https://www.nrv.gov.au/nutrients/selenium, last accessed 4/2/2015
  2. Australian Bureau of Statistics, 2014, Australian Health Survey: Nutrition First Results - Foods and Nutrients, 2011-12, 'Table 10: Proportion of Nutrients from food groups', data cube: Excel spreadsheet, cat. no. 4364.0.55.007

Zinc

Zinc is a mineral involved in a variety of body processes and found in a broad range of foods. Zinc’s biological functions range from helping maintain the structural integrity of proteins to regulation of gene expression. Sources of zinc in the Australian diet include meat, cereals and dairy.¹ There are numerous factors that can affect the absorption of zinc in the human body, for example the presence of protein and iron in the food consumed. The former increases absorption, particularly for proteins from animal sources, and the latter decreases it when present in high levels – such as those found in some dietary supplements.²

Proportion of population with inadequate zinc intakes (estimated as % below the EAR), by age

Age (years)EAR (mg)(a) Prevalence of inadequacy (%) 
 MalesFemalesMalesFemales
2-32.52.5--
4-83.03.0--
9-135.05.00.32.1
14-1811.06.027.410.0
19-3012.06.537.413.5
31-5012.06.539.310.1
51-7012.06.551.47.8
71 and over12.06.566.312.1

Source:
a. National Health and Medical Research Council and New Zealand Ministry of Health, 2006, Nutrient Reference Values for Australia and New Zealand, http://www.nrv.gov.au/nutrients/zinc

- nil or rounded to zero (including null cells)


More than one in three males (37%) and one in ten females (9%) had inadequate usual zinc intakes. From age 14, male requirements (EARs) for zinc are nearly twice those for females of the same age group. This corresponds with more males having inadequate intakes of zinc than females, despite males’ median intake of zinc being higher than females’ for every age group. The greatest prevalence of inadequacy was among males 71 years and over, where 66% had inadequate zinc intakes.

In contrast to the considerable proportion of adult males who had zinc intakes below the EAR, toddlers of both sexes were much more likely to exceed the UL for zinc. 63% of 2-3 year old males and 40% of 2-3 year old females exceeded their applicable UL.

The National Health and Medical Research Council and New Zealand Ministry of Health noted that there was no evidence of adverse effects from naturally occurring zinc in food.³ FSANZ considers that the usual zinc intakes for young children are not excessive and are unlikely to represent a health and safety risk to young children. Another way of assessing whether zinc intakes are excessive is to compare them with the Provisional Tolerable Daily Intake (1 mg/kg bw/day), an alternative health based guidance value. In a separate analysis conducted by FSANZ, zinc intakes in young Australian children were found to be within this health based guidance value.

Endnotes

  1. Australian Bureau of Statistics, 2014, Australian Health Survey: Nutrition First Results - Foods and Nutrients, 2011-12, 'Table 10: Proportion of Nutrients from food groups', data cube: Excel spreadsheet, cat. no. 4364.0.55.007
  2. National Health and Medical Research Council and New Zealand Ministry of Health, 2006, Nutrient Reference Values for Australia and New Zealand, https://www.nrv.gov.au/nutrients/zinc, last accessed 4/2/2015
  3. National Health and Medical Research Council and New Zealand Ministry of Health, 2005, Nutrient Reference Values for Australia and New Zealand, Evidence Appendix, Commonwealth of Australia, Canberra
  4. Food Standards Australia New Zealand, 2011, 23rd Australian Total Diet Study, http://www.foodstandards.gov.au/publications/pages/23rdaustraliantotald5367.aspx, last accessed 20/2/2015

Caffeine

Caffeine is a natural stimulant found in coffee, tea, and chocolate and a common additive to some drinks and powders.

Males and females had similar intakes of caffeine for each age group. Both males and females over 30 years consumed more caffeine than younger age groups on average, with daily median intakes of over 150 mg and daily mean intakes of over 170 mg for age groups 31-50 and 51-70 years. This is the equivalent of over four cups of black tea, or one and a half espresso shots of coffee. Approximately one quarter of 51-70 year olds consumed the equivalent of six to seven cups of tea or two to three espresso shots of coffee each day (75th percentile of caffeine intakes of 259 mg for males and 238 mg for females aged 51-70 years).

Data downloads

Table 1: summary

Table 2: macronutrients (including moisture)

Table 3: vitamins

Table 4: essential minerals (and caffeine)

Table 5: macronutrient contribution to energy

History of changes

Show all

27/04/2015 - Amendment made to release schedule page to direct users to the release schedules in the AHS and AATSIHS Users' Guide.

About the National Nutrition and Physical Activity Survey

The 2011–13 Australian Health Survey (AHS) is the largest and most comprehensive health survey ever held in Australia. The survey, conducted throughout Australia, collected a range of information about health related issues, including health status, risk factors, health service usage and medications. The 2011–13 AHS incorporated the National Nutrition and Physical Activity Survey (NNPAS). It involved the collection of detailed physical activity information using self-reported and pedometer collection methods, along with detailed information on dietary intake and foods consumed from over 12,000 participants across Australia. The nutrition component is the first national nutrition survey of adults and children (aged two years and over) conducted in over 15 years.

Information for the nutrition component of the NNPAS was gathered using a 24-hour dietary recall on all foods, beverages and dietary supplements consumed on the day prior to the interview. Where possible, at least eight days after the first interview, respondents were contacted to participate in a second 24-hour dietary recall via telephone interview.

This publication is jointly released by the Australian Bureau of Statistics (ABS) and Food Standards Australia New Zealand (FSANZ). It is the second release of information from the nutrition component of the NNPAS, and presents information on the usual intake of nutrients from foods as modelled from data collected in both first and second day interviews.

The AHS sample included Aboriginal and Torres Strait Islander people where they were randomly selected in the general population. The AHS also included an additional representative sample of Aboriginal and Torres Strait Islander people. The National Aboriginal and Torres Strait Islander Nutrition and Physical Activity Survey (NATSINPAS) will provide nutrition and physical activity results for Aboriginal and Torres Strait Islander people at the population level and provides an opportunity to compare results with the non-Indigenous population. Results for the nutrition component of the NATSINPAS will be released in the first half of 2015.

Acknowledgements

The NNPAS has been made possible by additional funding from the Australian Government Department of Health as well as the National Heart Foundation of Australia, and the contributions of these two organisations to improving health information in Australia through quality statistics are greatly valued.

The 2011–13 AHS, and particularly the NNPAS component, was developed with the assistance of several advisory groups and expert panels. Members of these groups were drawn from Commonwealth and state/territory government agencies, non-government organisations, relevant academic institutions and clinicians. The valuable contributions made by members of these groups are greatly appreciated.

In addition to being jointly responsible for the preparation and release of this publication, Food Standards Australia New Zealand (FSANZ) was contracted to provide advice throughout the survey development, processing and collection phases of the 2011-12 NNPAS, and to provide a nutrient database for the coding of foods and dietary supplements consumed. The ABS would like to acknowledge and thank FSANZ for providing their support, advice and expertise to the 2011-12 NNPAS.

The ABS gratefully acknowledges and thanks the Agricultural Research Service of the United States Department Agriculture for giving permission to adapt and use their Dietary Intake Data System, including the Automated Multiple-Pass Method for collecting dietary intake information, as well as other processing systems and associated materials. The ABS also gratefully acknowledges and thanks researchers at the National Cancer Institute (NCI) in the USA and elsewhere for developing and making available the NCI method and corresponding SAS macros, and providing expert advice on the use of the method.

Finally, the success of the 2011–13 AHS was dependent on the very high level of cooperation received from the Australian public. Their continued cooperation is very much appreciated; without it, the range of statistics published by the ABS would not be possible. Information received by the ABS is treated in strict confidence as required by the Census and Statistics Act 1905.

The structure of the Australian Health Survey

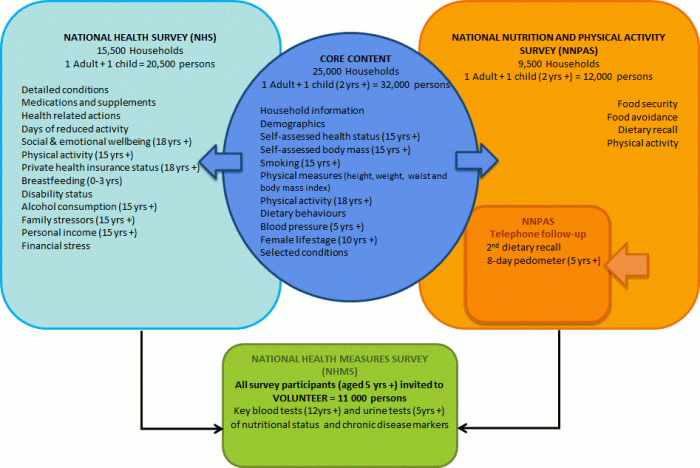
This publication is one of several ABS releases of results from the 2011-13 Australian Health Survey (AHS). The AHS is the largest, most comprehensive health survey ever conducted in Australia. It combines the existing ABS National Health Survey (NHS) and the National Aboriginal and Torres Strait Islander Health Survey (NATSIHS) together with two new elements - a National Nutrition and Physical Activity Survey (NNPAS) and a National Health Measures Survey (NHMS).

The following diagram shows how the various elements combine to provide comprehensive health information for the overall Australian population. The content for each component survey is listed along with the ages of respondents for which topics were collected.

Structure of the 2011-13 Australian Health Survey

Venn type diagram showing the components and content of the Australian Health Survey

Structure of the 2011-13 Australian Health Survey

A Venn diagram like image showing the components, flow and content of the Australian Health Survey (AHS). The Venn diagram comprises of 4 components: The first component relates to the centre circle with arrows pointing left and right. This circle provides information on the AHS Core Content. During this part of the survey, a total of 25,000 households and 32,000 persons were surveyed based on: Household information, Demographics, Self-assessed health status (persons who were 15 years or over were counted), Self-assessed body mass (persons who were 15 years or over were counted), Smoking (persons who were 15 years or over were counted), Physical measures (including: height, weight, waist and Body Mass Index), Physical activity (persons who were 18 years or over were counted), Dietary behaviours blood pressure (persons who were 5 years or over were counted), Female life stage (persons who were 10 years or over were counted), and Selected conditions. The second component relates to the left arrow, where it provides information on the 15,500 households who were surveyed during the National Health Survey (NHS). A total of 20,500 persons were surveyed based on: Detailed conditions, Medication and supplements, Health related actions, Days of reduced activity, Social and emotional wellbeing (persons who were 18 years or over were counted), Physical activity (persons who were 15 years or over were counted), Private health insurance status (persons who were 18 years or over were counted), Breastfeeding (persons who were between the age of 0-3 were counted), Disability status, Alcohol consumption (persons who were 15 years or over were counted), Family stressors (persons who were over 15 years or over were counted), Personal income persons who were 15 years or over were counted), and financial stress. From this component, there is a black arrow which points to the fourth, and final component. The third component relates to the right arrow, where it provides information on the 9,500 households who were surveyed during the National Nutrition Activity Survey (NNPAS). A total of 12,000 persons were surveyed based on: Food security, Food avoidance, Dietary recall, and Physical activity. This component also includes a box within this square, which provides information on the NNPAS telephone follow-up comprising of: 2nd dietary recall, and 8-day pedometer (persons who were 5 years or over were counted). From this component, there is a black arrow which points to the fourth, and final component. The final component relates to the green box which the second and third component refer to. This component relates to the information obtained from the 11,000 persons, who were 5 years or older, surveyed during the National Health Measures Survey (NHMS). The 11,000 volunteers were surveyed based on: Key blood tests (persons who were 12 years or older were counted) and urine tests (persons who were 5 years or older were counted) of nutritional status and chronic disease markers.

As shown in the above diagram, the AHS is made up of three components:

  • the National Health Survey (NHS)
  • the National Nutrition and Physical Activity Survey (NNPAS)
  • the National Health Measures Survey (NHMS).
     

All people selected in the AHS were selected in either the NHS or the NNPAS, however data items in the core were common to both surveys and therefore information for these data items is available for all persons in the AHS. All people were then invited to participate in the voluntary NHMS.

As indicated in the diagram, 20,500 people participated in the NHS, answering questions about items such as detailed health conditions, health risk factors and medications as well as all items in the core content. For the NHS component (those items collected only in the NHS and not the core), the sample size is similar to that of previous National Health Surveys and therefore the results are comparable. However for those items collected in the core, the sample size (32, 000 people) is approximately 1.5 times that in the past and therefore the estimates for core items such as smoking and Body Mass Index are expected to be more accurate in particular at finer disaggregates than in previous surveys.

Information for Aboriginal and Torres Strait Islander people

The AHS does not exclude Aboriginal and Torres Strait Islander people where they are randomly selected in the general population sample. However, the AHS also includes an additional representative sample of around 13,000 Aboriginal and Torres Strait Islander people for which first results were released in November 2013. This is a separate collection of Aboriginal and Torres Strait Islander people living in remote and non-remote areas, including discrete communities. The structure is the same as outlined above, comprised of the National Aboriginal and Torres Strait Islander Health Survey component, the National Aboriginal and Torres Strait Islander Nutrition and Physical Activity component and the National Aboriginal and Torres Strait Islander Health Measures Survey component.

For more information on future releases see Release schedule.

Release schedule

Results from the Australian Health Survey have been released progressively from October 2012 and will continue into 2015. Please see the Australian Health Survey: Users' Guide (cat. no. 4363.0.55.001) and the Australian Aboriginal and Torres Strait Islander Health Survey: Users' Guide (cat. no .4727.0.55.002) for more information on the release schedule.

Previous catalogue number

This release previously used catalogue number 4364.0.55.008.
 

Back to top of the page