|
|
INTRODUCTION
This snapshot provides an overview of Australia's health workforce, covering four key occupational groups: Generalist medical practitioners, Specialists, Dental practitioners, and Nurses (including midwives) (footnote 1). It examines their geographic distribution, their demographic characteristics, and their working arrangements. In doing so it provides information about current trends in key health occupations and their longer term sustainability.
There has been widespread discussion about the capacity of the existing health workforce in Australia to meet current needs (AIHW, 2006). While the health workforce has been growing at a faster rate than the population, patient demand for health services has been increasing at an even faster rate. Reasons for this include population ageing, research and technology increasing diagnosis and treatment, and increased access to services (AHWAC, AMWAC & AHWOC, 2005).
Access to appropriate health care is important for positive health outcomes. To achieve the best health outcomes for patients it is important to not just have appropriate infrastructure, but also an adequately sized and skilled workforce (Productivity Commission, 2005). Health workforce shortages can lead to outcomes such as poor access, unmet need, poorer health outcomes for patients and overworked doctors (WHO, 2006). People in remote areas face additional challenges in accessing medical services (DoHA, 2008).
While it has been widely recognised that the changing age structure of the population will increase demand for health services, at the same time these demographic changes also affect supply. Other factors affecting supply include ability to balance work with other commitments, for example raising children, changes in retirement patterns, and hours worked. Workforce planning is important, given the long lead times associated with training medical professionals (PC, 2005).
DATA SOURCES
This snapshot uses data from the 2006 Census of Population and Housing. It also presents data from previous Censuses for comparison purposes. Rates per 100,000 persons throughout this snapshot are calculated using the usual resident population count from the Census as the denominator. Not stated responses are included in the denominator for all analyses, except hours worked. Due to the Census collecting hours worked in the week prior to the Census, a number of people who normally work either full-time of part-time would have been away from work. Therefore persons working 0 hours in the week prior to the Census or those who did not state their hours worked were excluded from calculations involving hours worked.
The Census provides comprehensive data on small population groups, which allows detailed analysis of the characteristics of people working in health occupations that can not be obtained from other sources. However, the Census may be subject to a number of potential sources of error: respondent error, processing error, partial response and undercount. Census counts may also differ from data from registration boards and other sources due to differences in collection concepts and methodologies.
To minimise the risk of identifying individuals, the ABS utilises a technique to apply small random adjustments to data values. As a result, comparison between data items may show some minor discrepancies.
ENQUIRIES
For further information about these and related statistics, contact the National Information and Referral Service on 1300 135 070 or email client.services@abs.gov.au.
PEOPLE EMPLOYED IN HEALTH OCCUPATIONS
- According to the 2006 Census, there were 55,063 people working as Medical practitioners, 35,452 (around two-thirds) of whom were Generalist medical practitioners and 18,259 of whom were Specialists (footnote 2). There were also 9,071 people working as Dental practitioners and 219,788 people working as Nurses (footnote 3).
- Between 1986 and 2006, the per capita rate of Generalist medical practitioners increased from 152.6 to 178.6 per 100,000 persons. The rate of Specialists increased from 57.7 to 92.0 per 100,000 persons and the rate of Dental practitioners increased from 40.5 to 45.7 per 100,000 persons. The rate of Nurses decreased over the period from 1986 to 1996 (from 1,113.7 to 1,048.7 per 100,000 persons), before increasing to 1,106.9 per 100,000 persons in 2006.
- These changes, however, have not occurred evenly across Australia. Between 1986 and 2006, the per capita rate of Generalist medical practitioners increased at a faster in the remainder of Australia than in capital cities (footnote 4), while the the per capita rate of Specialists was similar in capital cities and the rest of Australia. While the rate of Nurses per 100,000 persons across Australia decreased slightly overall between 1986 and 2006, in areas outside the capital cities the rate per 100,000 increased from 1,047.0 to 1,133.4 over this period.
- However in 2006, the per capita rates of Generalist medical practitioners, Specialists, and Dental practitioners were all still higher in capital cities, despite faster growth in the remainder of Australia over the last 20 years.
- Australia's per capita rate of Medical practitioners is comparable to other similar countries, such as the USA, Canada, New Zealand and the UK. However, Australia has lower rates than some European countries, such as France, Greece and Italy (WHO, 2006).
SELECTED HEALTH OCCUPATIONS, 1986-2006
|
 | 1986 | 1996 | 2006 |
 |
|
| Generalist medical practitioners |  |  |  |
| Total (no.) | 23,715 | 29,061 | 35,452 |
| Rate per 100,000 persons(a): | 152.6 | 163.7 | 178.6 |
| in capital cities | 181.8 | 191.2 | 207.1 |
| in remainder of Australia | 103.0 | 117.3 | 128.5 |
 |  |  |  |
| Specialists |  |  |  |
| Total (no.) | 8,973 | 14,950 | 18,259 |
| Rate per 100,000 persons(a): | 57.7 | 84.2 | 92.0 |
| in capital cities | 73.3 | 105.8 | 116.1 |
| in remainder of Australia | 31.3 | 47.7 | 49.4 |
 |  |  |  |
| Dental practitioners |  |  |  |
| Total (no.) | 6,294 | 7,600 | 9,071 |
| Rate per 100,000 persons(a): | 40.5 | 42.8 | 45.7 |
| in capital cities | 47.0 | 50.5 | 55.4 |
| in remainder of Australia | 29.4 | 29.7 | 28.5 |
 |  |  |  |
| Nurses |  |  |  |
| Total (no.) | 173,102 | 186,166 | 219,788 |
| Rate per 100,000 persons(a): | 1,113.7 | 1,048.7 | 1,106.9 |
| in capital cities | 1,153.1 | 1,062.8 | 1,091.9 |
| in remainder of Australia | 1,047.0 | 1,024.8 | 1,133.4 |
|
| (a) Rates calculated using 2006 Census usual resident count. |
| Source: ABS 2006 Census of Population and Housing. |
GEOGRAPHIC DISTRIBUTION OF THE HEALTH WORKFORCE
- There are a range of factors that influence where medical professionals practise, such as family, social, and professional ties, lifestyle preferences, and market forces. Traditionally in Australia, these factors have tended to attract the highest concentration of the medical workforce to the inner suburbs and capital cities (AMWAC & AIHW, 1998).
- The per capita rates of the different groups of health workers varied between the states and territories.
- South Australia had the highest rate of all States and Territories of Specialists (109.6 per 100,000), Dental practitioners (51.5 per 100,000 persons) and Nurses (1,339.3 per 100,000 persons), as well as having a higher than average rate of Generalist medical practitioners (186.2 per 100,000 persons). The ACT also had higher than average rates per 100,000 persons for all selected health occupations, except for Nurses.
- While the Northern Territory had the highest rate of all States and Territories of Generalist medical practitioners (200.1 per 100,000), the rate for all other selected health occupations for the territory was lower than average. Queensland had a lower than average rate per 100,000 population for all selected health occupations.
- Tasmania had the lowest rate of Dental practitioners of all States and Territories (28.1 per 100,000).
SELECTED HEALTH OCCUPATIONS, by state, 2006
|
 | NSW | Vic | Qld | SA | WA | Tas | NT | ACT | Australia(a) |
 |
|
 | RATE PER 100,000 PERSONS(b) |
 |
|
| Generalist medical practitioners | 184.8 | 181.9 | 169.3 | 186.2 | 157.2 | 178.8 | 200.1 | 190.7 | 178.6 |
| Specialists | 92.2 | 93.9 | 82.5 | 109.6 | 93.3 | 85.2 | 71.5 | 104.6 | 92.0 |
| Dental practitioners | 47.5 | 43.5 | 44.7 | 51.5 | 47.0 | 28.1 | 32.7 | 51.5 | 45.7 |
| Nurses | 1,061.1 | 1,196.4 | 1,025.3 | 1,339.3 | 1,035.1 | 1,183.7 | 1,048.2 | 933.2 | 1,107.0 |
|
| (a) Includes Jervis Bay Territory, Christmas Island and Cocos (Keeling) Islands. |
| (b) Rates calculated using 2006 Census usual resident count. |
| Source: ABS 2006 Census of Population and Housing. |
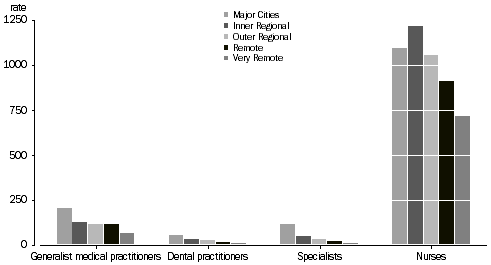
- People living in more remote areas tend to have poorer access to health services than those in less remote areas (footnote 5).
- In 2006, there were 204.9 Generalist medical practitioners per 100,000 persons in Major Cities, compared with 128.3 per 100,000 persons in Inner Regional Areas and 64.5 per 100,000 persons in Very Remote areas. A similar pattern was observed for Dental practitioners and Specialists.
- However, Nurses were an exception, with the highest rate in Inner Regional Areas (1,216.1 per 100,000 persons), but still lowest in Very Remote areas (715.8 per 100,000 persons).
SELECTED OCCUPATIONS BY REMOTENESS, Rate per 100,000 population, 2006
 Source: ABS 2006 Census of Population and Housing.
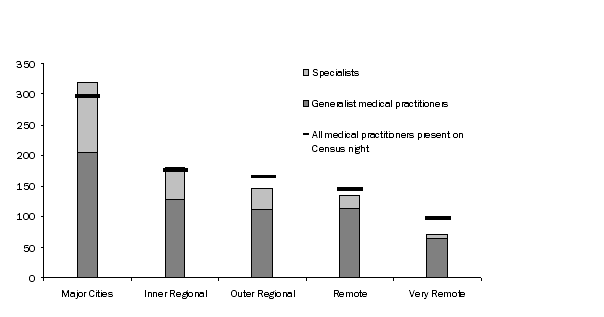
- The rates above are based on the usual residence of medical workers. However, to help meet the health needs of people in more remote areas, many Generalist medical practitioners and Specialists travel to more remote areas for regular or irregular work.
- Excluding those persons who did not report any hours worked in the week prior to Census Night and therefore were likely to be travelling for personal reasons, there were a total of 149 Medical Practitioners in Very Remote areas on Census Night, 37% more than the number who usually live there. Including these non-residents in the per capita rate partially reduces the difference in rates across remoteness areas.
SPECIALISTS AND GENERAL MEDICAL PRACTITIONERS, per 100,000 population, by remoteness area, 2006
 Source: ABS 2006 Census of Population and Housing.
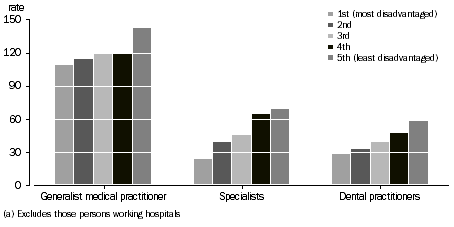
- To understand levels of access to primary health care services in disadvantaged areas, the number of medical workers working in an area (excluding those working in hospitals) was examined in conjunction with the SEIFA Index of Disadvantage (footnote 6). Information from the Census on the place of work of practitioners is used because it better reflects differences in level of access to services across areas by showing where the services are actually located rather than where the doctors live. For example, in 2006, only 5% of Generalist medical practitioners lived in the most disadvantaged Statistical Local Areas, but 11% of Generalist medical practitioners worked in these areas. Similarly, 42% of Generalist medical practitioners lived in the least disadvantaged Statistical Local Areas but 24% worked in these areas.
- The per capita rate of Generalist medical practitioners, Specialists and Dental practitioners working in an area all increase with declining levels of disadvantage.
- Levels of disadvantage tend to be higher in regional and remote areas, but the observed pattern of fewer medical and dental practitioners in more disadvantaged areas is still apparent in SLAs within major cities.
SELECTED MEDCIAL OCCUPATIONS(a), per 100,000 population, by SEIFA quintiles, 2006
 Source: ABS 2006 Census of Population and Housing.
DEMOGRAPHIC CHARACTERISTICS OF HEALTH WORKERS
GENERALIST MEDICAL PRACTITIONERS
GENERALIST MEDICAL PRACTITIONERS, 1986-2006
|
 | 1986 | 1996 | 2006 |
 |
|
| Total (no.) | 23,715 | 29,061 | 35,452 |
| Rate per 100,000 persons(a) | 152.6 | 163.7 | 178.6 |
| Proportion who were (%): |  |  |  |
| Female | 25.1 | 33.3 | 38.9 |
| Born overseas | 35.1 | 42.0 | 50.5 |
| Recent arrivals(b) | 2.7 | 4.9 | 10.1 |
| Aged 60 and over | 10.9 | 11.2 | 12.4 |
| Working part time | 14.7 | 18.9 | 22.2 |
|
| (a) Rates calculated using 2006 Census usual resident count. |
| (b) Recent arrivals are persons who were born overseas and arrived in the five years prior to the relevant Census year. |
| Source: ABS 2006 Census of Population and Housing. |
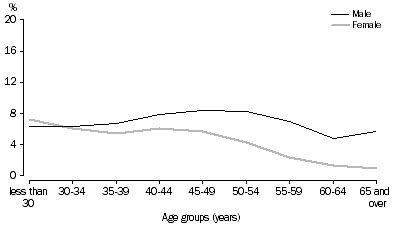
- The 20 years from 1986 to 2006 saw an increase in female participation in employment generally. However, the increase in the proportion of Generalist medical practitioners who were female was greater than the general increase in female workforce participation. Between 1986 and 2006, the proportion of Generalist medical practitioners who were women rose by 14 percentage points (from 25% to 39%), while the proportion of all employed persons who were women rose by 7 percentage points (from 39% to 46%).
- Since people entering this profession tend to do so when they are younger, an increasing rate of women becoming doctors first increases the proportion of women in the younger age groups in this profession. Consistent with this, in 2006, 53% of Generalist medical practitioners under 30 years of age were female.
- Generalist medical practitioners were older on average than the rest of the working population: 12% of Generalist medical practitioners were aged 60 or over, compared with 7% of all employed persons.
- There was a marked increase between 1986 and 2006 in the proportion of Generalist medical practitioners who were recent arrivals from overseas (that is, those who had arrived in Australia to live in the preceding five years), from 3% to 10%. This is consistent with government policy on entry to Australia of skilled labour in areas of workforce shortage through the General Skilled Migration programme. (DIAC, 2008)
GENERALISTS MEDICAL PRACTITIONERS, by age by sex, 2006
 Source: ABS 2006 Census of Population and Housing.
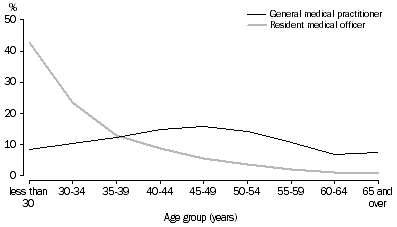
- After graduation, Generalist medical practitioners are generally required to undergo a period of further training within a hospital, under the supervision of medical specialists or senior general practitioners, to acquire full registration. The 2006 Census counted 5,499 of these Resident Medical Officers, 43% of whom were younger than 30, and 48% of whom were women.
GENERAL MEDICAL PRACTITIONERS AND RESIDENT MEDICAL OFFICERS, by age, 2006
 Source: ABS 2006 Census of Population and Housing.
SPECIALISTS
SPECIALISTS, 1986-2006
|
 | 1986 | 1996 | 2006 |
 |
|
| Total (no.) | 8,973 | 14,950 | 18,259 |
| Rate per 100,000 persons(a) | 57.7 | 84.2 | 92.0 |
| Proportion who were (%): |  |  |  |
| Female | 16.3 | 24.5 | 28.7 |
| Born overseas | 34.1 | 35.3 | 41.6 |
| Recent arrivals(b) | 3.5 | 5.5 | 8.6 |
| Aged 60 and over | 11.4 | 11.5 | 14.3 |
| Working part time | 10.7 | 13.2 | 17.1 |
|
| (a) Rates calculated using 2006 Census usual resident count. |
| (b) Recent arrivals are persons who were born overseas and arrived in the five years prior to the relevant Census year. |
| Source: ABS 2006 Census of Population and Housing. |
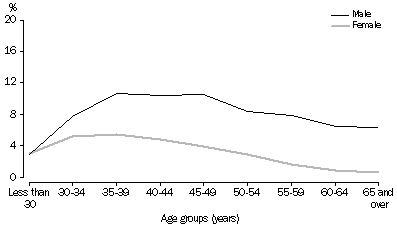
- The proportion of Specialists who were female increased from 16% in 1986 to 28% in 2006.
- In part reflecting the pattern for Generalist medical practitioners, there was a higher proportion of males in the older age groups. Of Specialists aged 60 and over, 89% were male.
- Amongst Specialists aged under 30, the majority (57%) were women. However, reflecting the number of years of training required, there are relatively few Specialists in the younger age groups. Of all Specialists, 6% were aged under 30, compared with 13% of Generalist medical practitioners.
SPECIALISTS, by age and sex, 2006
 Source: ABS 2006 Census of Population and Housing
- The broad occupational group of Specialists is made up of a number of quite different specialisations. The demographic characteristics of those employed in some specialisations are different to the characteristics of Specialists generally.
- Compared with other specialist occupations there were relatively large proportions of women employed as Endocrinologists, Pathologists and Dermatologists, although still more than 50% of people employed in these occupations were men.
- The surgical professions had the lowest proportion of women (11%). Notably, around 95% of Vascular surgeons, Cardiothoracic surgeons and Orthopaedic surgeons were men.
- The proportion of female Specialists has been increasing over time, leading to a larger proportion of women in the younger age groups. This is especially apparent in certain specialisations: 67% of Obstetricians and gynecologists aged under 40 were female, along with 58% of Clinical oncologists. This pattern however is not as evident amongst Surgeons: 17% of those aged under 40 were women.
- Some specialisations have a larger proportion of older workers than others. This may have implications for the long-term availability of these particular specialised medical services. Over one quarter of Specialist physicians (General medicine) were aged 60 years and over (28%). In contrast, there were comparatively few older workers employed as Emergency medicine specialists (less than 1% were aged 60 or over).
SPECIALISTS, 2006
| Occupation | Total (no.) | Proportion female (%) | Proportion aged 60 and over (%) |
| Anaesthetists | 2,726 | 26.0 | 10.4 |
| Internal medicine specialists, nfd | 27 | 22.2 | 22.2 |
| Specialist physician (general medicine) | 524 | 24.6 | 28.4 |
| Cardiologist | 454 | 14.5 | 13.7 |
| Clinical haematologist | 59 | 28.8 | 8.5 |
| Clinical oncologist | 196 | 39.3 | 6.1 |
| Endocrinologist | 82 | 47.6 | 7.3 |
| Gastroenterologist | 171 | 15.8 | 9.4 |
| Intensive care specialist | 281 | 24.9 | 2.8 |
| Neurologist | 216 | 19.9 | 20.4 |
| Paediatrician | 988 | 44.6 | 8.5 |
| Renal medicine specialist | 77 | 31.2 | 7.8 |
| Rheumatologist | 71 | 42.3 | 8.5 |
| Thoracic medicine specialist | 109 | 22.9 | 10.1 |
| Internal medicine specialists, nec | 339 | 50.1 | 9.1 |
| Psychiatrists | 2,179 | 39.5 | 19.3 |
| Dermatologist | 278 | 46.8 | 9.7 |
| Emergency medicine specialist | 764 | 36.1 | 0.8 |
| Obstetrician and gynaecologist | 899 | 38.6 | 14.8 |
| Ophthalmologist | 629 | 18.3 | 19.4 |
| Pathologist | 1,154 | 49.5 | 14.8 |
| Radiologist | 1,529 | 26.6 | 13.9 |
| Medical practitioners, nec | 594 | 36.0 | 12.6 |
| Surgeons, nfd | 1,927 | 13.1 | 21.6 |
| Surgeon (general) | 292 | 14.4 | 17.8 |
| Cardiothoracic surgeon | 110 | 5.5 | 12.7 |
| Neurosurgeon | 145 | 11.7 | 18.6 |
| Orthopaedic surgeon | 728 | 5.5 | 13.5 |
| Otorhinolaryngologist | 157 | 12.7 | 17.8 |
| Paediatric surgeon | 45 | 13.3 | 17.8 |
| Plastic and reconstructive surgeon | 239 | 14.2 | 14.6 |
| Urologist | 188 | 10.1 | 11.2 |
| Vascular surgeon | 76 | 5.3 | 23.7 |
| Total Specialists(a) | 18,259 | 28.7 | 14.3 |
(a) Includes other medical practitioners, nfd.
Source: ABS 2006 Census of Population and Housing.
DENTAL PRACTITIONERS
DENTAL PRACTITIONERS, 1986-2006
|
 | 1986 | 1996 | 2006 |
 |
|
| Total (no.) | 6,294 | 7,600 | 9,071 |
| Rate per 100,000 persons(a) | 40.5 | 42.8 | 45.7 |
| Proportion who were (%): |  |  |  |
| Female | 13.5 | 21.3 | 31.0 |
| Born overseas | 28.8 | 37.8 | 47.5 |
| Recent arrivals(b) | 2.7 | 2.8 | 6.0 |
| Aged 60 and over | 10.7 | 10.6 | 10.9 |
| Working part time | 19.0 | 21.7 | 28.4 |
|
| (a) Rates calculated using 2006 Census usual resident count. |
| (b) Recent arrivals are persons who were born overseas and arrived in the five years prior to the relevant Census year. |
| Source: ABS 2006 Census of Population and Housing. |
- In 2006, there were 9,071 people working as Dental practitioners, of whom 8,183 were Dentists and 844 were Dental specialists, such as Orthodontists and Periodontists (footnote 7).
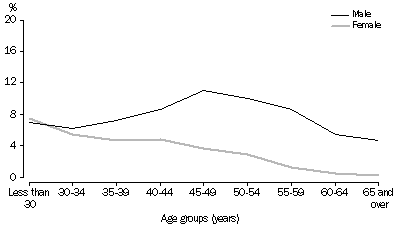
- The proportion of Dental practitioners who were women increased from 13% in 1986 to 31% in 2006. Reflecting this increase, in 2006, 52% of Dental practitioners aged under 30 were women. As with Medical practitioners, the proportion of Dental practitioners who were female steadily decreased with age.
- Higher proportions of women were observed in other related fields (not covered in this snapshot), for example 99% of Dental assistants and 97% of Dental therapists were female.
DENTAL PRACTITIONERS , by age and sex, 2006
 Source: ABS 2006 Census of Population and Housing
NURSES
NURSES, 1986-2006
|
 | 1986 | 1996 | 2006 |
 |
|
| Total (no.) | 173,102 | 186,166 | 219,788 |
| Rate per 100,000 persons(a) | 1,113.7 | 1,048.7 | 1,106.9 |
| Proportion who were (%): |  |  |  |
| Female | 92.6 | 91.7 | 91.0 |
| Born overseas | 22.2 | 24.0 | 27.3 |
| Recent arrivals(b) | 3.7 | 2.2 | 5.0 |
| Aged 60 and over | 1.5 | 2.2 | 6.0 |
| Working part time | 36.3 | 47.2 | 49.1 |
|
| (a) Rates calculated using 2006 Census usual resident count. |
| (b) Recent arrivals are persons who were born overseas and arrived in the five years prior to the relevant Census year. |
| Source: ABS 2006 Census of Population and Housing. |
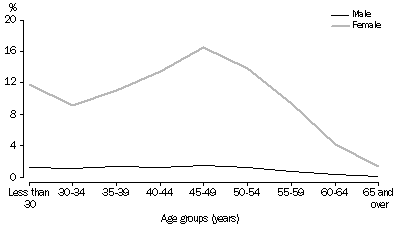
NURSES, by age and sex, 2006
 Source: ABS 2006 Census of Population and Housing
- At the time of the 2006 Census, there were 219,788 people working as Nurses, of whom 78% were Registered nurses, 9% were Enrolled nurses, and 6% were Midwives.
- Unlike medical and dental practice, nursing is a profession traditionally undertaken by women in Australia. Reflecting this, in 2006, 91% of Nurses were female. While the proportion of women working as Medical and Dental practitioners has increased significantly in recent years, the proportion of Nurses who are male has not increased to the same extent, from 7.4% in 1986 to 9.0% in 2006.
- A higher proportion of nurses were male in the fields of Mental health (33%) and Developmental disability (32%), possibly reflecting the greater physical demands of these nursing fields.
- In contrast, a negligible proportion of nurses were male in the fields of Child and family health, Midwifery, and Mothercraft nursing (around 1% or less).
- In 2006, the proportion of Nurses who worked part-time (footnote 8) (49%), was higher than the rate for all employed persons (31%). This largely reflected the large number of females working as Nurses. The rate of female Nurses who worked on a part-time basis (50%), was only slightly higher than the rate for all employed women (47%).
- The proportion of Nurses working part-time varied depending on the nursing field. Nearly two-thirds of Medical practice nurses worked part-time, compared with 24% of Nurse managers.
- In 2006, a higher than average proportion of recent arrivals from overseas (i.e. in the five years proceeding the Census), worked in the nursing fields of Critical care and emergency (7.0%), Medical (6.3%), Surgical (6.3%), and Perioperative (5.6%).
NURSES, 2006
|
 | Total (no.) | Proportion who were (%) |
 |  |
|
 |  | Male | Working part time | Aged 60 and over | Recent arrivals(a) |
 |
|
| Nurse practitioner | 333 | 11.7 | 38.9 | 6.3 | 4.8 |
| Registered nurses, nfd | 45,116 | 8.9 | 29.5 | 5.9 | 5.8 |
| Registered nurse (aged care) | 25,069 | 6.6 | 58.0 | 12.2 | 4.4 |
| Registered nurse (child and family health) | 3,621 | 1.3 | 56.8 | 7.2 | 3.9 |
| Registered nurse (community health) | 8,768 | 7.3 | 48.0 | 6.7 | 3.4 |
| Registered nurse (critical care and emergency) | 9,917 | 11.4 | 44.9 | 2.5 | 7.0 |
| Registered nurse (developmental disability) | 288 | 31.6 | 32.1 | 7.7 | 2.1 |
| Registered nurse (disability and rehabilitation) | 1,928 | 14.3 | 50.2 | 8.6 | 3.8 |
| Registered nurse (medical) | 5,043 | 7.2 | 53.4 | 5.0 | 6.3 |
| Registered nurse (medical practice) | 3,710 | 2.3 | 66.0 | 7.3 | 4.6 |
| Registered nurse (mental health) | 7,714 | 33.4 | 29.5 | 6.2 | 6.7 |
| Registered nurse (perioperative) | 10,008 | 7.2 | 50.5 | 5.3 | 5.6 |
| Registered nurse (surgical) | 3,225 | 5.7 | 55.0 | 4.1 | 6.3 |
| Registered nurses, nec | 47,830 | 8.7 | 48.3 | 4.7 | 6.5 |
| Midwife | 12,236 | 1.0 | 63.6 | 4.6 | 3.6 |
| Nurse educator | 2,823 | 9.2 | 36.8 | 4.8 | 2.7 |
| Nurse researcher | 926 | 6.0 | 46.1 | 3.3 | 3.5 |
| Nurse manager | 10,899 | 12.2 | 24.2 | 6.4 | 3.0 |
| Enrolled nurse | 18,953 | 9.7 | 52.2 | 4.1 | 1.8 |
| Mothercraft nurse | 439 | 0.0 | 57.2 | 4.6 | 0.7 |
| Total Nurses(b) | 219,788 | 9.0 | 49.1 | 6.0 | 5.0 |
|
| (a) Arrived in Australia in the five years preceding the 2006 Census. |
| (b) Total includes nurse educators and researchers nfd, registered nurses nfd, enrolled and mothercraft nurses nfd and midwifery and nursing professionals nfd. |
| Source: ABS 2006 Census of Population and Housing. |
COUNTRY OF BIRTH
- A comparatively large proportion of Australia's health workforce was born overseas. While 22% of the total Australian population were born overseas, 50% of Generalist medical practitioners, 42% of Specialists, 47% of Dental practitioners, and 27% of Nurses were born overseas.
- For people who were working in selected health occupations, as with the broader population, the most common country of birth other than Australia was England.
- However, the distribution of countries of birth for people working in selected health occupations was different to the broader population. For example, while people born in India made up 0.7% of all people in the 2006 Census, they made up 5.4% of Generalist medical practitioners and 4.2% of Specialists. Similarly, people born in Malaysia made up 0.5% of all people in Australia, but 5.3% of Dental practitioners.
- Nurses were more likely than the Australian average to have been born in England and New Zealand. While people born in England made up 4% of all people in Australia, they made up 7% of Nurses; and while people born in New Zealand made up 2% of all people born in Australia they made up 3% of Nurses. A comparatively large proportion of Nurses were also born in the Philippines: 2.0% of Nurses were born in the Philippines compared with 0.6% of all people in Australia.
PROPORTION OF PERSONS WORKING IN HEALTH OCCUPATIONS BORN IN SELECTED COUNTRIES(a), 2006
|
 | Generalist medical practitioners (%) | Specialists (%) | Dental practitioners (%) | Nurses (%) | Australia total (%) |
 |
|
| Australia | 48.2 | 57.2 | 51.1 | 70.6 | 70.9 |
| England | 6.3 | 8.1 | 5.6 | 7.1 | 4.3 |
| New Zealand | 1.7 | 3.2 | 2.3 | 3.0 | 2.0 |
| China(b) | 1.6 | 0.6 | 1.5 | 0.7 | 1.0 |
| Italy | 0.4 | 0.3 | 0.4 | 0.2 | 1.0 |
| Vietnam | 1.8 | 0.6 | 3.9 | 0.2 | 0.8 |
| India | 5.4 | 4.2 | 2.5 | 0.7 | 0.7 |
| Philippines | 0.8 | 0.4 | 0.6 | 2.0 | 0.6 |
| Malaysia | 5.1 | 3.1 | 5.3 | 1.4 | 0.5 |
|
| (a) Selected countries incorporate the five most commonly reported countries of birth overall, and any of the four most commonly reported countries of birth for each occupation group that was not already included. |
| (b) Excludes SARs and Taiwan Province. |
| Source: ABS 2006 Census of Population and Housing. |
- The overseas-born health workers discussed above include those who train after migrating to Australia as well as those who have trained overseas and subsequently migrate. Given the long lead times in training those in health occupations, people already trained overseas are able to start work more quickly than training additional people in Australia. Due to the lengthy training required, people who work in health occupations and have arrived in Australia within the previous five years are likely to have trained overseas.
- At the 2006 Census, there were 3,586 of these recently arrived Generalist medical practitioners, 1,566 recently arrived Specialists, and 10,995 recently arrived Nurses.
- India, England and South Africa were the most common countries of birth for recently arrived Medical practitioners, accounting for 36% of Generalist medical practitioners and 49% of Specialists.
- The most common countries of birth for Nurses who arrived to live in Australia in the past five years were England (25%), New Zealand (12%) and the Philippines (7.6%), while for recently arrived Dental practitioners, the most common countries of birth were England (15%), India (15%) and New Zealand (8.2%).
RECENT ARRIVALS(a), by selected country of birth, 2006
|
 | 1986 | 1996 | 2006 |
 |
|
| Generalist medical practitioners (no.) | 639 | 1,429 | 3,586 |
| Proportion recently arrived from (%): |  |  |  |
| England | 22.1 | 20.9 | 9.8 |
| New Zealand | 16.0 | 12.2 | 3.2 |
| India | 8.3 | 9.8 | 19.2 |
| South Africa | 8.0 | 4.3 | 6.8 |
| Ireland | 2.3 | 4.0 | 1.5 |
| Philippines | 0.8 | 0.7 | 3.7 |
| Other | 42.6 | 48.1 | 55.9 |
 |  |  |  |
| Specialists (no.) | 317 | 819 | 1,566 |
| Proportion recently arrived from (%): |  |  |  |
| England | 24.3 | 21.0 | 14.8 |
| New Zealand | 17.4 | 14.4 | 7.7 |
| India | 3.8 | 15.1 | 23.3 |
| South Africa | 6.9 | 7.7 | 11.0 |
| Ireland | 3.8 | 2.4 | 2.1 |
| Philippines | 0.9 | 1.2 | 2.4 |
| Other | 42.9 | 38.1 | 38.6 |
 |  |  |  |
| Nurses (no.) | 6,397 | 4,037 | 10,995 |
| Proportion recently arrived from (%): |  |  |  |
| England | 24.0 | 25.3 | 24.9 |
| New Zealand | 24.0 | 16.5 | 11.7 |
| India | 1.2 | 1.8 | 5.9 |
| South Africa | 1.8 | 1.6 | 7.1 |
| Ireland | 4.9 | 6.9 | 2.6 |
| Philippines | 4.6 | 5.4 | 7.6 |
| Other | 39.5 | 42.5 | 40.3 |
|
| (a) Arrived in Australia in the five years preceding the 2006 Census. |
| Source: ABS 2006 Census of Population and Housing. |
- There have been changes in the source countries of recently arrived Medical practitioners over the past 20 years. For example, the most common birthplace for recently arrived Generalist medical practitioners in 1986 was England (22%), but by 2006 this had decreased to 10%. Over the same period, the proportion of recently arrived Medical practitioners who were born in India increased from 8% to 19%. This pattern is similar for Specialists.
- The proportion of recently arrived Nurses who were born in England has remained relatively constant over the last 20 years, while the proportion born in New Zealand has more than halved. Conversely, the proportion of recent arrivals born in South Africa increased from 1.8% in 1986 to 7.1% in 2006, and the proportion born in the Philippines increased from 4.6% to 7.6%.
- Government policy currently restricts access to Medicare provider numbers for overseas-trained doctors to districts of workforce shortage (DOHA, 2008). Consistent with this, the proportion of Generalist medical practitioners who were recent arrivals was higher in Remote and Very Remote areas of Australia. Generalist medical practitioners who arrived in Australia in the last five years accounted for more than a quarter of the Generalist medical practitioners in Remote and Very Remote areas. Conversely, recently arrived Nurses were most likely to work in Major Cities, accounting for 6.4% of those in Major Cities.
PROPORTION IN EACH REMOTENESS AREA WHO ARE RECENT ARRIVALS, 2006 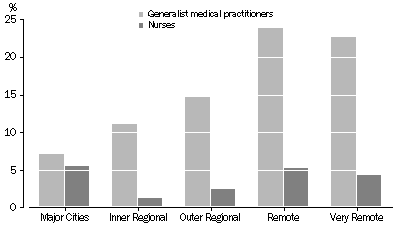 Source: ABS 2006 Census of Population and Housing
- At the 2006 Census, there were 65,306 persons who reported having a medical qualification as their highest qualification, 12,095 who reported having dentistry qualifications and 379,949 persons who reported having nursing qualifications (footnote 9).
- Most people whose highest qualification was in a health field are either employed in a health occupation or are aged 55 and over and are likely to have retired from the workforce. Of employed persons, 86% of people with medical qualifications as their highest qualification were working as Medical practitioners and 85% of people with dentistry qualifications were working as Dental practitioners. However, the proportion was lower for those with Nursing qualifications: 70% of people with nursing qualifications were working as Nurses. In the case of Nurses, this equated to 79,194 people with nursing qualifications working in occupations other than nursing. In addition, persons with a qualification in a health-related field were not identified by the Census if they also had a higher qualification in another field.
- Another potential source of skilled employees are those who have health-related qualifications but who are not currently employed, as they may be able to re-enter employment with minimal training.
- Women were less likely than men to be in the labour force in all age groups. This difference was greatest for those under 40, which reflects the age at which women are most likely to be having children. Of persons aged under 55, 14% of women whose highest qualification was a medical qualifications and had children under 15 were not in the labour force compared with 8% of those who did not have children under 15. Conversely, 2% of men with medical qualifications who had children under 15 were not in the labour force compared with 5% who did not.
- Of persons aged 55 and over, 65% of persons whose highest qualification was a medical qualifications and 39% of persons with nursing qualifications were in the labour force, compared with 29% of all persons aged 55 and over. This reflects the greater tendency of health professionals, particularly Medical practitioners, to remain in the workforce for longer.
- That said, there were 51,779 persons aged between 55 and 74 with nursing qualifications as their highest qualification who were not in the labour force, and 3,248 persons with medical qualifications.
- Reflecting the level of demand for health occupations, the unemployment rate was relatively low for persons with medical qualifications (1.2%), persons with dentistry qualifications (1.4%), or persons with nursing qualifications (1.7%) as their highest qualification. These rates were lower than for persons with other degrees (3.0%), no degree (5.8%) and all persons in 2006 (5.2%).
PERSONS NOT IN THE LABOUR FORCE, selected fields of qualification, by age by sex, 2006 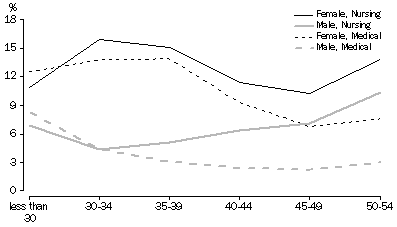 Source: ABS 2006 Census of Population and Housing
- Generalist medical practitioners mainly worked in Medical services (such as private or group general medical practices), while there were fairly even proportions of Specialists in Hospitals and Medical services. The vast majority of Dental practitioners (90%) were employed in Other health care and social assistance (mainly in Dental services), with a smaller proportion employed in Hospitals.
- Most Nurses (63%) were employed in Hospitals, although a relatively large proportion of Nurses were employed in Other health care and social assistance (27%), mainly in Aged and other residential care. Those Nurses employed outside the Health care and social assistance industry tended to be employed in Labour Supply Services, which supply contract or temporary labour.
INDUSTRY OF EMPLOYMENT, 2006
|
 | Hospitals | Medical services | Other health care and social assistance | Other | Not stated/
inadequately described |
 |
|
 | PROPORTION (%) |
 |
|
| Generalist medical practitioners | 29.5 | 62.4 | 4.4 | 3.4 | 0.3 |
| Specialists | 40.7 | 41.6 | 13.9 | 3.6 | 0.3 |
| Dental practitioners | 4.4 | 1.6 | 89.6 | 3.9 | 0.5 |
| Nurses | 62.8 | 3.9 | 27.2 | 5.7 | 0.4 |
|
| Source: ABS 2006 Census of Population and Housing. |
EMPLOYMENT TYPE
- Amongst Dental practitioners, 61% reported owning their own business, along with 44% of Generalist medical practitioners and 41% of Specialists. The proportion of Nurses reporting owning their own business was negligible.
- The proportion of Specialists owning their own business varied between different specialisations. High rates of Rheumatologists, Urologists, Dermatologists, Plastic and reconstructive surgeons and Otorhinolaryngologists (Ear nose and throat specialists) reported owning their own business, compared with very low rates of Emergency medicine specialists, Intensive care specialists and Pathologists (who tended to work in Hospitals).
- When excluding those working in hospitals, 68% of Specialists and 61% of Generalist medical practitioners owned their own business.
- Of those who owned their own business, 92% of Dental practitioners had employees, compared with 84% of Specialists and 80% of Generalist medical practitioners.
HOURS WORKED
- Medical practitioners (both Generalist medical practitioners and Specialists) worked longer hours than employed persons generally. This pattern held regardless of whether they were male or female, or worked in Hospitals or in Medical services.
- According to the AMA, working excessively long hours could impact on the quality and safety of medical care provided to patients, and be detrimental to the wellbeing of the medical professionals themselves (AMA, 2006).
- Of those working full time, 69% of Specialists and 61% of Generalist medical practitioners reported working 45 hours or more a week. Over a third (38%) of Specialists and 29% of Generalist medical practitioners reported working 55 or more hours a week. More Specialists (15%) and Generalist medical practitioners (10%) worked 65 or more hours a week than employed persons (6%).
- Amongst the different kinds of Specialists, there were some differences in hours worked. Of full-time Surgeons, 28% worked 65 or more hours a week, including 46% of Neurosurgeons and 45% of Paediatric surgeons.
- Both full-time Dental practitioners and Nurses were less likely than Medical practitioners to work long hours with 35% of full-time Dental practitioners and 20% of full-time Nurses working 45 hours or more a week. Of full-time Dental Practitioners, 10% reported working 55 or more hours a week and 2% reported working 65 hours a week or more. Of full-time Nurses 8% reported working 55 or more hours a week and 4% reported working 65 or more hours a week.
HOURS WORKED, for full-time workers, 2006 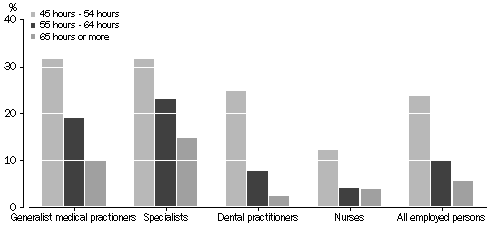 Source: ABS 2006 Census of Population and Housing
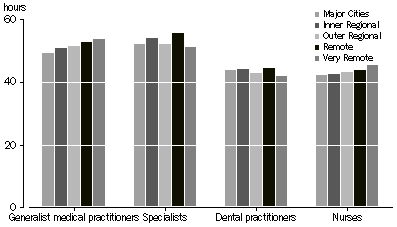
- The average hours worked by full-time Generalist medical practitioners and Nurses increased with remoteness. In 2006, full-time Generalist medical practitioners worked an average of 53.6 hours a week in Very Remote areas compared with an average of 49.2 hours a week in Major Cities. Similarly, full-time Nurses worked an average of 45.4 hours a week in Very Remote areas compared with an average of 42.3 hours in Major Cities.
- These findings may partly reflect the lower rates per capita of Generalist medical practitioners and Nurses in more remote areas. However, Specialists and Dental practitioners also have lower rates per capita in more remote areas, but do not show the same relationship between hours worked and remoteness.
AVERAGE HOURS WORKED BY REMOTENESS, for full-time workers, 2006
 Source: ABS 2006 Census of Population and Housing
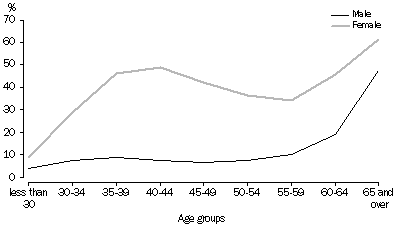
- While most Medical practitioners work full time, in the 20 years between 1986 and 2006 there were steady increases in the proportion working part-time hours. In 1986, 15% of Generalist medical practitioners and 11% of Specialists worked part-time. By 2006, the figures were 22% and 17% respectively.
- These findings are largely driven by an increase in the proportion of women working as Medical practitioners (in 2006, 36% of female Medical practitioners worked part-time compared with 12% of males), as well as a greater proportion of older workers, many of whom work part-time. However, there has also been an increase generally in Medical practitioners working part-time hours. For example, the number of males aged under 60 working part-time has increased from 4.4% in 1986 to 7.6% in 2006.
- Medical practitioners working in Medical services were twice as likely to work part-time than those working in Hospitals (24% compared with 12%).
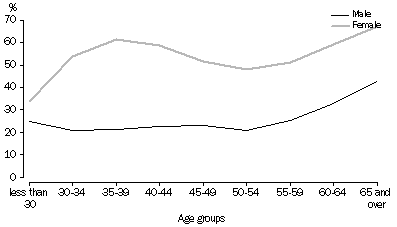
- The proportion of Nurses working part-time increased from 36% in 1986 to 47% in 1996, but then rose only slightly to 49% in 2006.
- The highest proportion of females working part-time hours was between the ages of 30 and 44, when 58% of female Nurses in this age group worked part-time, along with 41% of female Medical practitioners. This reflects the years when women are likely to be caring for young children.
PART-TIME MEDICAL PRACTITIONERS, by age by sex, 2006
 Source: ABS 2006 Census of Population and Housing
PART-TIME NURSES, by age by sex, 2006
 Source: ABS 2006 Census of Population and Housing
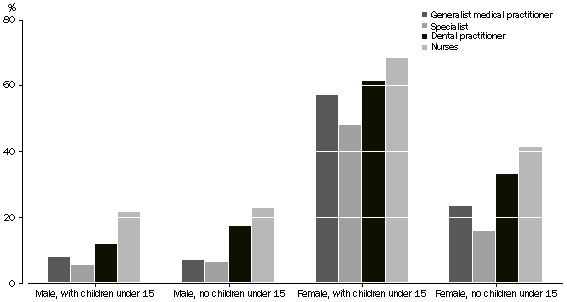
- Of those aged under 55, women were much more likely to be working part-time if they had children under 15 regardless of their occupation. For example, 57% of female Generalist medical practitioners with children under 15 worked part-time, compared with 24% who did not have children in this age group. Conversely, men in health occupations, aged under 55, were no more likely to work part-time hours regardless of whether or not they had children under 15.
PROPORTION WORKING PART-TIME, by sex and whether has children under 15, for persons under 55, 2006
 Source: ABS 2006 Census of Population and Housing
REFERENCES
ABS (Australian Bureau of Statistics) 2007, Australian Social Trends 2007, Australian Bureau of Statistics, Canberra
AHWAC (Australian Health Workforce Advisory Committee), AMWAC (Australian Medical Workforce Advisory Committee) & AHWOC (Australian Health Workforce Officials' Committee) 2005, Demand for Health Services and the Health Workforce, Australian Health Workforce Advisory Committee & Australian Medical Workforce Advisory Committee, Sydney
AMWAC & AIHW (Australian Institute of Health and Welfare) 1998, Medical Workforce Supply and demand in Australia: A Discussion Paper, Australian Medical Workforce Advisory Committee, Sydney
AIHW 2006, Australia's Health 2006, Australian Institute of Health and Welfare, Canberra
AMA (Australian Medical Association) 2006, Safe Hours = Safe Patients: AMA Safe Hours Audit 2006, Australian Medical Association, Canberra
DIAC (Department of Immigration and Citizenship) 2008, Professionals and other skilled migrants, viewed 16 May 2008, www.immi.gov.au/skilled/general-skilled-migration/index.htm
DOHA (Department of Health and Ageing) 2008, Restrictions for permanent residents, viewed 16 May 2008, www.doctorconnect.gov.au/internet/otd/publishing.nsf/Content/employ-medicare-permres
DoHA 2008, Report on the Audit of Health Workforce in Rural and Regional Australia, Department of Health and Ageing, Canberra
PC (Productivity Commission) 2005, Australia's Health Workforce, Productivity Commission, Canberra
WHO (World Health Organisation) 2006, The World Health Report 2006: Working together for Health, viewed 5 June 2008, http://www.oecdobserver.org/news/get_file.php3/id/25/file/OECDInFigures2006-2007.pd
1. Occupations are based on the main job held in the week prior to Census night and are coded according to the Australian and New Zealand Standard Classification of Occupations (ANZSCO).
2. Medical practitioners diagnose and provide medical care to patients to promote and restore good health. They are divided into Generalist and Specialists. Generalist medical practitioners (ANZSCO unit group 2531) have a Bachelor degree or higher and at least one year of hospital based training. Specialists are medical practitioners who specialise in a particular field of medicine. They generally undergo two years of hospital-based training and at least five years specialist study and training in addition to a Bachelor degree in medicine. This category includes the ANZSCO Unit Groups, 2533 Internal medicine specialists, 2535 Surgeons, 2534 Psychiatrists, 2532 Anaesthetists and 2539 Other medical practitioners (such as Obstetricians and gynaecologists). In 2006 there were a further 1,352 Medical practitioners that could not be classified as either Generalist medical practitioners or Specialists.
3. Nurses and midwives provide nursing care to patients in a variety of settings. This category includes the Unit Groups 2544 Registered nurses, 2541 Midwives, 2542 Nurse educators and researchers and 2543 Nurse managers who usually have a Bachelor degree or higher. Also included in this category are 4114 Enrolled and mothercraft nurses who usually have a Diploma or above and work under the supervision of a registered nurse or midwife.
4. Capital cities include the capital city statistical division for each state and territory in Australia. All other areas are included in the remainder of Australia.
5. Remoteness is determined by measuring the physical road distance to different classes of service centres. Different non-contiguous geographic areas which share common characteristics of remoteness are then grouped together into five categories or remoteness areas: Major Cities, Inner Regional, Outer Regional, Remote and Very Remote.
6. Socio-Economic Indexes for Areas (SEIFA) provides a series of summary measures of the level of social and economic wellbeing in an area.The indexes are compiled from various characteristics of persons resident in particular areas; the index of disadvantage summarises attributes such as low income, low educational attainment, high unemployment and jobs in relatively unskilled occupations. The index is divided into 5 equally sized groups or quintiles, with the first quintile being the most disadvantaged and the fifth quintile being the least
7. A further 44 Dental practitioners could not be classified as either Dentists or Dental specialists.
8. Persons are defined as working part-time hours if they worked 1-34 hours in the week prior to the Census.
9. Qualification refers to the person's highest completed non-school qualification. Consequently, persons with a qualification in a health-related field will not be identified by the Census if they have a higher qualification in another field (for example if a person has a Bachelor degree in Nursing but a Graduate Diploma in Management). For the purposes of this snapshot, persons with medical and dentistry qualifications are those whose qualification level is stated to be a Bachelor degree of higher. As enrolled nurses are not required to have a Bachelor degree, persons with nursing qualifications includes people with any level of qualification.
|
|
 Print Page
 Print All