NOTES
OVERVIEW
This is the final issue of this electronic product. It is intended that future state and territory-specific data will be made available in spreadsheet format with releases of the relevant annual national publications.
This electronic product provides a demographic overview of Australia for 2004. It contains summary tables and commentary on trends in the components of population change including births, deaths and migration. This product also includes marriages, divorces and the estimated resident population. Various demographic rates and comparisons between the states and territories of Australia are presented. Population and migration data are for the year ended 30 June 2004, while births, deaths, marriages and divorces data are for the year ended 31 December 2004. More recent data are released quarterly in Australian Demographic Statistics (cat. no. 3101.0).
Demography publications for each state and territory can be accessed from the Related Information tab at the top of this page. Additional state demographic data are also available from publications and data cubes linked at the top of this page. The Demography Theme Page provides links to other Australian as well as international demographic statistics. The National Regional Profiles provide economic and social statistics of Statistical Local Areas and Local Government Areas of Australia.
INQUIRIES
For further information about these and related statistics, contact the National Information and Referral Service on 1300 135 070 or Neil Scott on Canberra (02) 6252 5997.
SUMMARY COMMENTARY
POPULATION
In the year to 30 June 2004 Australia's estimated resident population increased by 218,900 persons to reach 20,091,500 (9,990,500 males and 10,101,000 females). Over three-quarters of the population resided in either New South Wales (NSW), Victoria or Queensland in 2004 (comprising 33.5%, 24.7% and 19.4% of the Australian population respectively). The Australian Capital Territory (ACT) accounted for 1.6% of Australia's population, and the Northern Territory accounted for 1.0%.
Australia's population increased by 1.1% in 2003-04. The populations of all states and territories increased during this period with Queensland experiencing the highest rate of growth at 2.3%. Other states to experience growth of at least 1.0% were Western Australia (1.4%), Victoria and Tasmania (both 1.0%). The lowest rates of growth were recorded in the ACT (0.2%), South Australia (0.4%), NSW and the Northern Territory (both 0.6%).
Queensland also recorded the largest increase in population of the states and territories, up 87,000 persons, accounting for 39.8% of Australia's total population growth in 2004. Victoria recorded the second largest increase, up 51,500 persons, while NSW increased by 38,700 persons.
ANNUAL POPULATION GROWTH, States and territories - year ended 30 June 2004
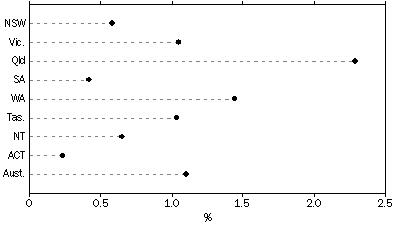
Natural increase, the excess of births over deaths, accounted for over half of the total Australian population increase in 2004 of 118,900 persons. Net overseas migration contributed 100,000 persons.
All states and territories experienced both positive natural increase and net overseas migration in 2004. Net interstate migration remained highest for Queensland, continuing the long term trend. Tasmania and Western Australia also experienced positive net interstate migration. NSW and South Australia both continued their long term trends of losing population through negative net interstate migration.
POPULATION AND HOUSEHOLDS, States and territories - 2004 at 30 June |
|  |
 |  |  | NSW | Vic. | Qld | SA | WA | Tas. | NT | ACT | Aust.(a) |  |
|  |
| Estimated resident population | ('000) | 6 720.8 | 4 963.0 | 3 888.1 | 1 532.7 | 1 978.1 | 482.2 | 199.8 | 324.1 | 20 091.5 |  |
| Components of population change(b) |  |  |  |  |  |  |  |  |  |  |  |
 | Natural increase(c) | no. | 39 363 | 28 816 | 24 953 | 5 318 | 13 225 | 1 756 | 2 750 | 2 692 | 118 892 |  |
 | Net overseas migration | no. | 29 820 | 25 020 | 25 399 | 4 305 | 13 634 | 700 | 648 | 456 | 99 966 |  |
 | Net interstate migration | no. | -30 445 | -2 291 | 36 686 | -3 197 | 1 272 | 2 475 | -2 108 | -2 392 | . . |  |
| Total increase(b)(d) | no. | 38 738 | 51 545 | 87 038 | 6 426 | 28 131 | 4 931 | 1 290 | 756 | 218 858 |  |
| Annual growth rate(b) | % | 0.58 | 1.05 | 2.29 | 0.42 | 1.44 | 1.03 | 0.65 | 0.23 | 1.10 |  |
| Projected households(e) | ('000) | 2 565.9 | 1 915.8 | 1 504.8 | 634.9 | 772.1 | 198.3 | 64.8 | 126.3 | 7 782.8 |  |
|  |
| . . not applicable |
| (a) Includes Other Territories. |
| (b) From 30 June of previous year. |
| (c) Excess of births over deaths. Births and deaths figures used to compile natural increase for population estimates are based on year of occurrence and may differ from births and deaths data based on year of registration given in the Births and Deaths sections of this paper. |
| (d) Includes intercensal discrepancy not accounted for by natural increase and net migration. |
| (e) Series II from Household and Family Projections, Australia, 2001-2026 (Cat. no. 3236.0). |
BIRTHS AND CONFINEMENTS
During 2004 there were 254,200 births registered in Australia, from 250,000 mothers (confinements). The three most populous states accounted for over three-quarters of registered births in 2004, with 85,900 births to mothers usually resident in NSW (33.8% of all births), 62,400 in Victoria (24.5%) and 49,900 in Queensland (19.6%). There were 3,600 births to mothers usually resident in the Northern Territory (1.4%, the smallest proportion of all births in Australia). Sex ratios at birth for all states and territories were greater than 100, ranging from 102.9 male births per 100 female births in the Northern Territory to a ratio of 108.4 in Tasmania.
The total fertility rate (TFR), that is the average number of babies that a woman could expect to bear during her reproductive lifetime, was 1.77 children per woman for Australia in 2004. The Northern Territory recorded the highest TFR (2.24 children per woman) and was the only state or territory with a TFR greater than the replacement rate of 2.1. Tasmania had the second highest TFR with a rate of 1.93, while the Australian Capital Territory experienced the lowest TFR, with 1.64.
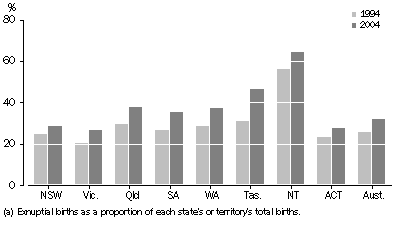
In 2004 there were 172,500 nuptial births in Australia, representing 67.8% of all births decreasing from 74.4% in 1994. Victoria had the highest proportion of nuptial births of all states and territories (73.2%), followed by the ACT (72.2%) and NSW (71.5%). The proportion of exnuptial births was greatest in the Northern Territory (64.3%) followed by Tasmania (46.3%).
EXNUPTIAL BIRTHS(a), States and territories - 1994 and 2004
The median age of mothers who registered a birth in Australia in 2004 was 30.6 years. The ACT and Victoria had the oldest mothers, with median ages of 31.6 years and 31.3 years respectively. The ACT and Victoria also had the oldest fathers, with median ages of 33.4 years and 33.3 years respectively. The youngest mothers were in the Northern Territory (28.3 years) and Tasmania (29.2 years). Tasmania had the youngest fathers (31.6 years) followed by the Northern Territory (31.8 years).
BIRTHS AND CONFINEMENTS, States and territories - 2004(a) |
|  |
 |  |  | NSW | Vic. | Qld | SA | WA | Tas. | NT | ACT | Aust.(b) |  |
|  |
| Live births |  |  |  |  |  |  |  |  |  |  |  |
 | Number | no. | 85 894 | 62 417 | 49 940 | 17 140 | 25 295 | 5 809 | 3 551 | 4 174 | 254 246 |  |
 | Crude birth rate(c) | rate | 12.8 | 12.6 | 12.8 | 11.2 | 12.8 | 12.0 | 17.8 | 12.9 | 12.7 |  |
 | Total fertility rate(d) | rate | 1.794 | 1.701 | 1.811 | 1.707 | 1.807 | 1.927 | 2.239 | 1.637 | 1.774 |  |
 | Net reproduction rate(e) | rate | 0.859 | 0.823 | 0.873 | 0.823 | 0.871 | 0.913 | 1.072 | 0.779 | 0.853 |  |
| All confinements |  |  |  |  |  |  |  |  |  |  |  |
 | Number | no. | 84 568 | 61 286 | 49 102 | 16 869 | 24 896 | 5 702 | 3 510 | 4 086 | 250 045 |  |
 | Median age of mother | years | 30.6 | 31.3 | 29.8 | 30.8 | 30.2 | 29.2 | 28.3 | 31.6 | 30.6 |  |
| Nuptial confinements |  |  |  |  |  |  |  |  |  |  |  |
 | Number | no. | 60 385 | 44 784 | 30 448 | 10 848 | 15 592 | 3 043 | 1 247 | 2 943 | 169 312 |  |
 | Median age of mother | years | 31.4 | 32.0 | 31.2 | 32.0 | 31.6 | 30.9 | 31.8 | 32.3 | 31.6 |  |
 | Median age of father | years | 33.6 | 33.9 | 33.1 | 33.9 | 33.7 | 33.1 | 33.8 | 34.0 | 33.6 |  |
| First nuptial confinements |  |  |  |  |  |  |  |  |  |  |  |
 | Number | no. | 25 680 | 20 115 | 12 630 | 4 840 | 6 460 | 1 264 | 532 | 1 279 | 72 808 |  |
 | Median age of mother | years | 30.2 | 30.8 | 30.0 | 30.9 | 30.4 | 29.7 | 30.8 | 31.1 | 30.4 |  |
|  |
| (a) Year of registration. |
| (b) Include Other Territories. |
| (c) Births per 1,000 population. |
| (d) Births per woman. |
| (e) Daughters surviving to reproductive age per woman. |
DEATHS
There were 132,500 deaths registered in Australia in 2004, with 46,400 (35.0% of total deaths) registered in New South Wales, 32,500 (24.5%) in Victoria, and 24,500 (18.5%) in Queensland. The sex ratio at death was 106.7 male deaths per 100 female deaths, and ranged from 102.2 male deaths per 100 female deaths in Victoria to a rate of 169.8 in the Northern Territory.
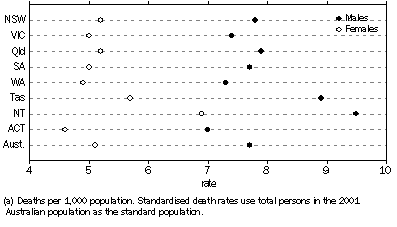
The standardised death rate (SDR), which eliminates the effect of the changing age structure of the population was 6.3 deaths per 1,000 standard population. The Australian Capital Territory experienced the lowest SDR of 5.6 deaths per 1,000, whereas the Northern Territory experienced the highest rate of 8.2 deaths per 1,000 population. Males generally have a higher SDR than females; this was evident in all states and territories in 2004.
STANDARDISED DEATH RATES (a), States and territories - 2004
In 2004 life expectancy at birth was 78.1 years for males, and 83.0 years for females. The highest life expectancy for both males and females was recorded in the ACT, with 79.7 years for males and 83.9 years for females. The lowest life expectancy for males and females was recorded in the Northern Territory where the expectation of life at birth was 72.3 years and 78.0 years respectively.
The median age of death was also lowest in the Northern Territory for both males (55.0 years) and females (61.2 years), well below the national values of 76.6 years for males and 82.6 years for females. The median age at death was highest in South Australia, with 77.5 years for males and 83.2 years for females.
The infant mortality rate (IMR) for Australia was 4.7 infant deaths per 1,000 live births in 2004. The Northern Territory recorded an IMR of 10.7, the highest of all states and territories. The second highest IMR was 6.9 in the ACT.
DEATHS, States and territories - 2004(a) |
|  |
 |  |  | NSW | Vic. | Qld | SA | WA | Tas. | NT | ACT | Aust.(b) |  |
|  |
| Number | no. | 46 440 | 32 522 | 24 514 | 11 629 | 11 184 | 3 892 | 893 | 1 423 | 132 508 |  |
| Crude death rate(c) | rate | 6.9 | 6.6 | 6.3 | 7.6 | 5.7 | 8.1 | 4.5 | 4.4 | 6.6 |  |
| Standardised death rate(d) | rate | 6.3 | 6.0 | 6.5 | 6.2 | 6.0 | 7.1 | 8.2 | 5.6 | 6.3 |  |
| Median age at death |  |  |  |  |  |  |  |  |  |  |  |
 | Males | years | 76.9 | 77.3 | 75.9 | 77.5 | 75.6 | 76.5 | 55.0 | 75.2 | 76.6 |  |
 | Females | years | 82.7 | 83.0 | 82.2 | 83.2 | 81.9 | 82.5 | 61.2 | 80.8 | 82.6 |  |
| Infant deaths |  |  |  |  |  |  |  |  |  |  |  |
 | Number | no. | 399 | 282 | 262 | 54 | 99 | 21 | 38 | 29 | 1 184 |  |
 | Infant mortality rate(e) | rate | 4.6 | 4.5 | 5.2 | 3.2 | 3.9 | 3.6 | 10.7 | 6.9 | 4.7 |  |
| Life expectancy at birth(f) |  |  |  |  |  |  |  |  |  |  |  |
 | Males | years | 78.0 | 78.5 | 77.8 | 78.0 | 78.6 | 76.7 | 72.3 | 79.7 | 78.1 |  |
 | Females | years | 83.3 | 83.3 | 82.9 | 83.1 | 83.3 | 81.8 | 78.0 | 83.9 | 83.0 |  |
|  |
| (a) Year of registration. |
| (b) Includes Other Territories. |
| (c) Deaths per 1,000 population. |
| (d) Deaths per 1,000 population. Standardised death rates use total persons in the 2001 Australian population as the standard population. |
| (e) Deaths per 1,000 live births. |
| (f) From 1995 onwards expectation of life has been calculated using three years of data. |
MIGRATION
In 2003-04 Australia gained 100,000 persons as a result of net overseas migration (NOM). Each state and territory increased its population through NOM. The largest gain was recorded by NSW, with an increase of 29,800 persons (29.8% of Australia's NOM), while the smallest increase was recorded by the ACT, gaining 460 persons.
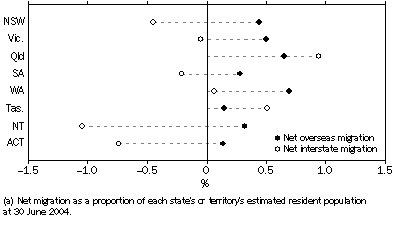
An estimated 386,400 persons moved interstate in 2003-04. Queensland, Tasmania and Western Australia were the only states to experience net interstate migration gains. The greatest increase was in Queensland, which gained 36,700 persons, followed by Tasmania which gained 2,500 persons. All other states and territories experienced net interstate losses of varying magnitude, with the largest loss recorded by NSW (30,400 persons). The Northern Territory had the smallest population loss due to net interstate migration, losing 2,100 persons. Proportionately, however, the Northern Territory lost 1.1% of its population through interstate migration while Queensland gained the largest proportion (0.9%).
NET MIGRATION(a), - States and territories - 2003-04
The largest interstate flows in 2004 were between NSW, Victoria and Queensland. The most common move was from NSW to Queensland (61,100 persons or 15.8% of all interstate movers). This flow was much greater than the next largest flow, from Queensland to NSW (36,500 persons or 9.5% of all interstate movers). Queensland continued to be the most popular destination for Australians moving interstate, receiving the largest number of arrivals during 2004 (115,600 persons). Over half of Queensland's arrivals came from NSW (52.9%), followed by Victoria (21.6%) and Western Australia (7.1%). Of all interstate departures NSW accounted for the largest loss (120,700 persons), nearly one third of all interstate departures in 2004. Migrants from South Australia and Tasmania were most likely to move to Victoria whereas those from the Northern Territory were most likely to move to Queensland. There was a high degree of movement between the Australian Capital Territory and surrounding NSW.
MIGRATION, States and territories - 2004 at 30 June |
|  |
 |  |  | NSW | Vic. | Qld | SA | WA | Tas. | NT | ACT | Aust.(a) |  |
|  |
| Overseas migration |  |  |  |  |  |  |  |  |  |  |  |
 | Permanent and long-term movement(b) |  |  |  |  |  |  |  |  |  |  |  |
 | Arrivals | no. | 155 162 | 101 018 | 67 272 | 18 025 | 45 970 | 3 353 | 2 755 | 7 755 | 401 316 |  |
 | Departures | no. | 98 048 | 54 285 | 39 754 | 10 368 | 23 433 | 2 326 | 1 844 | 6 614 | 236 696 |  |
 | Net overseas migration(c) | no. | 29 820 | 25 020 | 25 399 | 4 305 | 13 634 | 700 | 648 | 456 | 99 966 |  |
| Interstate migration |  |  |  |  |  |  |  |  |  |  |  |
 | Arrivals | no. | 90 270 | 71 655 | 115 635 | 27 032 | 32 297 | 16 204 | 15 383 | 17 889 | 386 365 |  |
 | Departures | no. | 120 715 | 73 946 | 78 949 | 30 229 | 31 025 | 13 729 | 17 491 | 20 281 | 386 365 |  |
 | Net interstate migration | no. | -30 445 | -2 291 | 36 686 | -3 197 | 1 272 | 2 475 | -2 108 | -2 392 | . . |  |
|  |
| . . not applicable |
| (a) Includes Other Territories. |
| (b) Based on stated intention on arrival or departure. |
| (c) Figures have been adjusted for changes in traveller intention and multiple mover error. |
MARRIAGES
There were 111,000 marriages registered in Australia in 2004; of these 67.2% were marriages in which neither party had been previously married and 14.8% involved both parties remarrying. The remaining 18.0% involved one of the partners having been previously married.
The crude marriage rate for Australia was 5.5 marriages per 1,000 population. The lowest crude marriage rate was in the Northern Territory (3.9 marriages) and the highest was in Queensland (6.3 marriages).
For Australia the median age of brides marrying in 2004 was 29.2 years while the median age of bridegrooms was 31.5 years. The median age of brides was highest in Tasmania (30.6 years) while the median age of bridegrooms was highest in the Northern Territory (33.2 years). The lowest median age of brides was recorded in NSW (28.8 years) while the lowest median age of bridegrooms was recorded in the ACT (30.9 years).
MARRIAGES, States and territories - 2004(a) |
|  |
 |  |  | NSW | Vic. | Qld | SA | WA | Tas. | NT | ACT | Aust.(b) |  |
|  |
| Number registered | no. | 37 431 | 25 587 | 24 312 | 7 883 | 10 601 | 2 648 | 777 | 1 719 | 110 958 |  |
| Crude marriage rate(c) | rate | 5.6 | 5.2 | 6.3 | 5.1 | 5.4 | 5.5 | 3.9 | 5.3 | 5.5 |  |
| Median age at marriage |  |  |  |  |  |  |  |  |  |  |  |
 | Bridegroom | years | 31.2 | 31.4 | 31.6 | 31.8 | 31.9 | 33.0 | 33.2 | 30.9 | 31.5 |  |
 | Bride | years | 28.8 | 29.4 | 29.4 | 29.3 | 29.6 | 30.6 | 30.5 | 28.9 | 29.2 |  |
|  |
| (a) For 2004, marriage registrations were sampled for New South Wales, Victoria, Queensland and South Australia, and therefore subject to sampling error. The marriage registrations for the remaining states and territories were fully enumerated. |
| (b) Includes Other Territories. |
| (c) Marriages per 1,000 population. |
DIVORCES
There were 52,700 divorces granted in Australia in 2004, 0.7% less than the number granted in 2003 (53,100). Nationally the number of divorces has increased over the last decade by 9.2% from a total of 48,300 divorces registered in 1994. During 2004 all states and territories except Queensland and Tasmania recorded a decrease in the number of divorces. Queensland recorded its highest number of divorces on record with 13,300, an increase of 36.0% since 1994. Across Australia in 2004, 28.0% of all applications for a divorce were joint applications whereas 41.0% were made by wives and 31.0% by husbands.
The crude divorce rate (the number of divorces per 1,000 population) in 2004 was 2.6. New South Wales, Western Australia and the Northern Territory each recorded the lowest crude divorce rate (2.2) and Queensland the highest (3.4). This comparison excludes the rate for the ACT which is inflated by divorces granted in the territory involving persons usually resident in New South Wales.
The national median age at divorce continued its long term trend, increasing again in 2004 to reach 43.0 years for males and 40.3 years for females. This was an increase of 3.4 years for males and 3.5 years for females since 1994. The rise in the median age at divorce is associated with increasing age at first marriage and an increase in the interval between marriage and divorce.
DIVORCES, States and territories - 2004 |
|  |
 |  |  | NSW | Vic. | Qld | SA | WA | Tas. | NT | ACT | Aust.(a) |  |
|  |
| Number granted | no. | 15 007 | 12 544 | 13 279 | 4 147 | 4 337 | 1 404 | 434 | 1 595 | 52 747 |  |
| Crude divorce rate(b) | rate | 2.2 | 2.5 | 3.4 | 2.7 | 2.2 | 2.9 | 2.2 | np | 2.6 |  |
| Median duration of marriage |  |  |  |  |  |  |  |  |  |  |  |
 | To separation | years | 7.6 | 8.8 | 9.1 | 10.0 | 9.1 | 10.6 | 8.0 | 9.7 | 8.7 |  |
 | To divorce | years | 11.2 | 12.4 | 12.8 | 13.6 | 12.8 | 14.1 | 11.8 | 13.1 | 12.3 |  |
|  |
| np not available for publication but included in totals where applicable, unless otherwise indicated |
| (a) Includes Other Territories. |
| (b) Divorces per 1,000 population. |
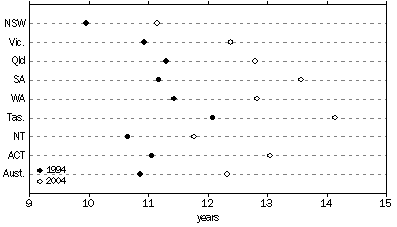
Over the years the median duration of marriage (the interval between the date of marriage and the date of divorce) has continued to increase, and in 2004 was the highest recorded at 12.3 years. Variation between the states and territories ranged from 11.2 years in NSW to 14.1 years in Tasmania. The median duration of marriage to the time the parties separated has also increased over time from 7.6 years in 1994 to 8.7 years in 2004.
MEDIAN DURATION TO DIVORCE, States and territories - 1994 and 2004
RELATED LINKS
From the Related Information Tab there are links to other releases providing more specific or in-depth analysis and information.
 Print Page
 Print All