NOTES
OVERVIEW
This is the final issue of this electronic product. It is intended that future state and territory-specific data will be made available in spreadsheet format with releases of the relevant annual national publications.
This electronic product provides a demographic overview of Victoria, 2004. It contains summary tables and commentary on trends in the components of population change including births, deaths and migration. Marriages, divorces, estimated resident population and various demographic rates are also presented. Population and migration data are for the year ended 30 June 2004, while births, deaths, marriages and divorces data are for the year ended 31 December 2004. More recent data are released quarterly in Australian Demographic Statistics (cat. no. 3101.0).
For comparisons between the states and territories of Australia, please refer to Demography, Australia, 2004 (cat. no. 3311.0.55.001). Demography publications for each state and territory can be accessed from the Related Information tab at the top of this page. Additional state demographic data are also available from publications and data cubes linked at the top of this page. The Demography Theme Page provides links to other Australian as well as international demographic statistics. The National Regional Profiles provide economic and social statistics of Statistical Local Areas and Local Government Areas of Australia.
INQUIRIES
For further information about these and related statistics, contact the National Information and Referral Service on 1300 135 070 or Ken Willis on Melbourne (03) 9615 7392.
SUMMARY COMMENTARY
POPULATION
At 30 June 2004, the estimated resident population of Victoria was 4,963,000 persons, approximately one-quarter of the Australian population. In 2003-04, Victoria's population increased by 51,500 persons, consisting of natural increase (28,800 persons) and overseas migration (25,000 persons). This was a growth rate of 1.0% compared to a rate of 1.1% for Australia. The states and territories that had the highest rates of growth in 2003-04 were Queensland (2.3%) and Western Australia (1.4%).
Between 1993-94 and 2003-04, Victoria's population increased by 475,000 persons, a growth rate of 11% compared to 13% for Australia. In the same period, the highest rates of growth occurred in Queensland (22%), Western Australia (16%) and the Northern Territory (15%).
COMPONENTS OF POPULATION CHANGE
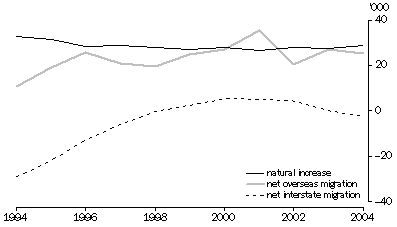
POPULATION AND HOUSEHOLDS, Victoria - Selected years at 30 June |
|  |
 |  |  | 1994 | 2003 | 2004 |  |
|  |
| Estimated resident population | ('000) | 4 487.6 | 4 911.4 | 4 963.0 |  |
| Components of population change(a) |  |  |  |  |  |
 | Natural increase(b) | no. | 32 576 | 27 392 | 28 816 |  |
 | Net overseas migration | no. | 10 698 | 26 777 | 25 020 |  |
 | Net interstate migration | no. | -29 195 | 28 | -2 291 |  |
| Total increase(a)(c) | no. | 15 183 | 54 197 | 51 545 |  |
| Annual growth rate(a) | % | 0.34 | 1.12 | 1.05 |  |
| Estimated resident households(d) | ('000) | 1 643.0 | nya | nya |  |
| Projected households(e) | ('000) | . . | 1 884.1 | 1 915.8 |  |
|  |
| . . not applicable |
| nya not yet available |
| (a) From 30 June of previous year. |
| (b) Excess of births over deaths. Births and deaths figures used to compile natural increase for population estimates are based on year of occurrence and may differ from births and deaths data based on year of registration displayed in the Births and Deaths sections of this paper. |
| (c) Includes intercensal discrepancy not accounted for by natural increase and net migration. |
| (d) Based on 1996 census data. |
| (e) Series II from Household and Family Projections, Australia, 2001-2026 (Cat. no. 3236.0). |
MIGRATION
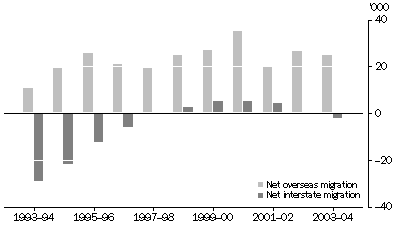
In 2003-04, Victoria recorded the second highest net migration gain of all the states and territories (22,700 persons). Almost all of this migration gain was due to overseas migration.
The contribution of net overseas migration to Victoria's population growth fluctuated each year from 1993-94 to 2003-04. During this period, the highest contribution (35,300 persons) occurred in 2000-01 and the lowest (10,700 persons) occurred in 1993-94.
Historically - in the period 1972-73 to 1997-98 - net interstate migration meant a loss of population for Victoria. From 1998-99 to 2002-03, it has provided small population gains to Victoria - the highest contributions (5,200 persons) occurring in 1999-2000 and 2000-01, the lowest (30 persons) occurring in 2002-03.
NET MIGRATION
BIRTHS AND CONFINEMENTS
In 2004, there were 61,300 confinements resulting in 62,400 live births registered to mothers usually resident in Victoria. Registrations of births were 2% higher than in 2003 (61,100 births).
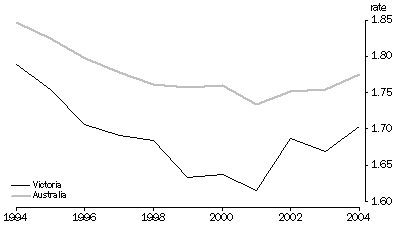
The total fertility rate - that is the average number of babies that a woman could expect to give birth to in her lifetime if she experienced current age-specific fertility rates - was 1.70 babies per woman in 2004. This was the second lowest of all the states and territories and was a slight increase from the rate of 1.67 in 2003.
The median age of all Victorian mothers giving birth increased to 31.3 years in 2004, compared to a median age of 29.5 years in 1994. In 2004, this was the second highest median age of mothers of all the states and territories.
TOTAL FERTILITY RATES
BIRTHS AND CONFINEMENTS, Victoria - Selected years(a) |
|  |
 |  |  | 1994 | 2003 | 2004 |  |
|  |
| Live births |  |  |  |  |  |
 | Number | no. | 63 974 | 61 058 | 62 417 |  |
 | Crude birth rate(b) | rate | 14.3 | 12.4 | 12.6 |  |
 | Total fertility rate(c) | rate | 1.785 | 1.666 | 1.701 |  |
 | Net reproduction rate(d) | rate | 0.857 | 0.804 | 0.823 |  |
| All confinements |  |  |  |  |  |
 | Number | no. | 63 085 | 59 989 | 61 286 |  |
 | Median age of mother | years | 29.5 | 31.2 | 31.3 |  |
| Nuptial confinements |  |  |  |  |  |
 | Number | no. | 50 110 | 43 944 | 44 784 |  |
 | Median age of mother | years | 30.1 | 31.8 | 32.0 |  |
 | Median age of father | years | 32.4 | 33.7 | 33.9 |  |
| First nuptial confinements |  |  |  |  |  |
 | Number | no. | 21 013 | 19 377 | 20 115 |  |
 | Median age of mother | years | 28.7 | 30.6 | 30.8 |  |
|  |
| (a) Year of registration. |
| (b) Births per 1,000 population. |
| (c) Births per woman. |
| (d) Daughters surviving to reproductive age per woman. |
DEATHS
In 2004, there were 32,500 registered deaths of persons usually resident in Victoria. The standardised death rate (see Glossary) was 6.0 deaths per 1,000 population, which was lower than the national rate of 6.3 deaths per 1,000 population.
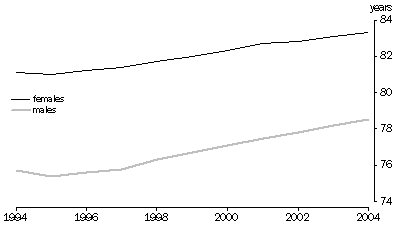
In 2004, the upward trend in life expectancy continued for females and males in Victoria. Females born in 2004 could expect to live an average of 83.3 years compared to 81.1 years for those born in 1994. The corresponding figures for males were 78.5 years (2004) and 75.7 years (1994). The ACT had the highest life expectancies of all the states and territories with females and males born in 2004 expected to live an average of 83.9 years and 79.7 years respectively.
LIFE EXPECTANCY AT BIRTH
DEATHS, Victoria - Selected years(a) |
|  |
 |  |  | 1994 | 2003 | 2004 |  |
|  |
| Number | no. | 32 353 | 32 925 | 32 522 |  |
| Crude death rate(b) | rate | 7.2 | 6.7 | 6.6 |  |
| Standardised death rate(c) | rate | 8.0 | 6.3 | 6.0 |  |
| Median age at death |  |  |  |  |  |
 | Males | years | 74.0 | 76.8 | 77.3 |  |
 | Females | years | 80.6 | 82.6 | 83.0 |  |
| Infant deaths |  |  |  |  |  |
 | Number | no. | 327 | 309 | 282 |  |
 | Infant mortality rate(d) | rate | 5.1 | 5.1 | 4.5 |  |
| Life expectancy at birth(e) |  |  |  |  |  |
 | Males | years | 75.7 | 78.2 | 78.5 |  |
 | Females | years | 81.1 | 83.1 | 83.3 |  |
|  |
| (a) Year of registration. |
| (b) Deaths per 1,000 population. |
| (c) Deaths per 1,000 population. Standardised death rates use total persons in the 2001 Australian population as the standard population. |
| (d) Deaths per 1,000 live births. |
| (e) From 1995 onwards expectation of life has been calculated using three years of data. |
MARRIAGES
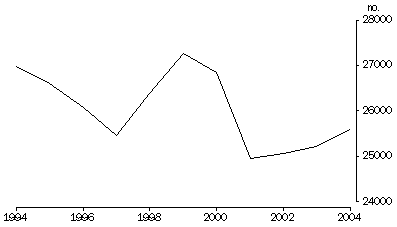
In 2004, there were 25,600 marriages registered in Victoria. These represent a crude marriage rate of 5.2 marriages per 1,000 persons residing in Victoria, lower than the national rate of 5.5 marriages per 1,000 population.
Between 1994 and 2004, the number of marriages registered in Victoria declined by 5%. The decrease in registrations was not uniform over this period as shown in the graph below.
There has been a continual increase in median ages at marriage for brides and bridegrooms in Victoria. The median ages at marriage for brides were 26.6 years in 1994 and 29.4 years in 2004, while for bridegrooms the corresponding figures were 28.8 years and 31.4 years respectively.
NUMBER OF MARRIAGES REGISTERED
MARRIAGES, Victoria - Selected years(a) |
|  |
 |  |  | 1994 | 2003 | 2004 |  |
|  |
| Number registered(a) | no. | 26 974 | 25 211 | 25 587 |  |
| Crude marriage rate(b) | rate | 6.0 | 5.1 | 5.2 |  |
| Median age at marriage |  |  |  |  |  |
 | Bridegroom | years | 28.8 | 31.2 | 31.4 |  |
 | Bride | years | 26.6 | 29.3 | 29.4 |  |
|  |
| (a) For 2004, marriage registrations were sampled for Victoria and therefore subject to sampling error. |
| (b) Marriages per 1,000 population. |
DIVORCES
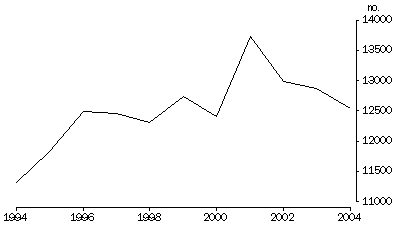
In 2004, there were 12,500 divorces granted in Victoria, a crude divorce rate of 2.5 divorces per 1,000 population. The national rate was slightly higher at 2.6 divorces per 1,000 population.
The 12,500 divorces granted in 2004 are an 11% increase over the 11,300 granted in 1994 and a 9% decrease from the 13,700 granted in 2001, which was the highest number on record. Of the 12,500 applications for divorce in 2004, over 99% were granted through the Federal Magistrates Court of Australia (FMC). The proportion of cases handled by the FMC in Victoria was 59% in 2001, 65% in 2002 and 68% in 2003.
The FMC (formally known as the Federal Magistrates Service) was established in September 2000 to provide a simpler and more accessible service for litigants and to ease the workload of both the Family Court of Australia and the Federal Court of Australia.
Median duration of marriage (see Glossary) was 12.4 years in 2004 compared to 10.9 years in 1994. The median interval between marriage and separation also increased in the same period, from 7.7 years in 1994 to 8.8 years in 2004.
NUMBER OF DIVORCES GRANTED
DIVORCES, Victoria - Selected years |
|  |
 |  |  | 1994 | 2003 | 2004 |  |
|  |
| Number granted | no. | 11 320 | 12 865 | 12 544 |  |
| Crude divorce rate(a) | rate | 2.5 | 2.6 | 2.5 |  |
| Median duration of marriage |  |  |  |  |  |
 | To separation | years | 7.7 | 8.7 | 8.8 |  |
 | To divorce | years | 10.9 | 12.3 | 12.4 |  |
|  |
| (a) Divorces per 1,000 population. |
RELATED LINKS
Demographic data for all Victorian statistical local areas are available from the data cube linked on the Details tab at the top of this page.
From the Related Information Tab there are links to other releases providing more specific or in-depth analysis and information.
 Print Page
 Print All