SEPTEMBER KEY FIGURES
 | | Sep 17 | Aug 17 to Sep 17 | Sep 16 to Sep 17 |
| | no. | % change | % change |
|
| TREND | | | |
| Total dwelling units approved | 18 863 | 1.8 | -0.4 |
| Private sector houses | 9 929 | 0.7 | 4.4 |
| Private sector dwellings excluding houses | 8 688 | 3.2 | -5.1 |
| SEASONALLY ADJUSTED | | | |
| Total dwelling units approved | 18 849 | 1.5 | 0.2 |
| Private sector houses | 9 867 | 0.6 | 2.1 |
| Private sector dwellings excluding houses | 8 754 | 2.6 | -2.4 |
|
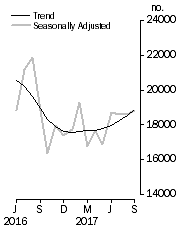
Dwelling units approved
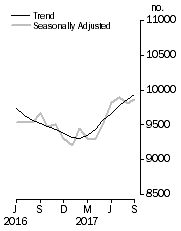
| Private sector houses approved
|
SEPTEMBER KEY POINTS
TOTAL DWELLING UNITS
- The trend estimate for total dwellings approved rose 1.8% in September and has risen for eight months.
- The seasonally adjusted estimate for total dwellings approved rose 1.5% in September and has risen for two months.
PRIVATE SECTOR HOUSES
- The trend estimate for private sector houses approved rose 0.7% in September and has risen for seven months.
- The seasonally adjusted estimate for private sector houses rose 0.6% in September following a fall of 0.8% in the previous month.
PRIVATE SECTOR DWELLINGS EXCLUDING HOUSES
- The trend estimate for private sector dwellings excluding houses rose 3.2% in September and has risen for four months.
- The seasonally adjusted estimate for private sector dwellings excluding houses rose 2.6% in September and has risen for two months
VALUE OF BUILDING APPROVED
- The trend estimate of the value of total building approved rose 1.3% in September and has risen for nine months. The value of residential building rose 1.5% and has risen for five months. The value of non-residential building rose 1.0% and has risen for eight months.
- The seasonally adjusted estimate of the value of total building approved rose 8.3% in September after falling for two months. The value of residential building rose 0.1% and has risen for two months. The value of non-residential building rose 22.4% following a fall of 10.9% in the previous month.
NOTES
FORTHCOMING ISSUES
| ISSUE | Release Date |
| September 2017 - Additional | 9 November 2017 |
| October 2017 | 30 November 2017 |
| October 2017 - Additional | 7 December 2017 |
| November 2017 | 9 January 2018 |
| November 2017 - Additional | 16 January 2018 |
| December 2017 | 1 February 2018 |
DATA NOTES
In this release, revisions are provided for the time period from July 2016 to August 2017 and include revisions resulting from the Building Approvals Annual Review. Further information about the Annual Review and other potential sources of revisions can be found in the feature article released with the January 2016 8731.0 publication - "
Revisions to Building Approval Statistics".
Small area data cubes will be made available in an “Additional Information” release five business days after the main publication. The data cubes will be for Statistical Area Level 2 and Local Government Areas. Release dates are published under the “
Forthcoming Issues” section of the publication and in ABS Release Advice.
A number of time series spreadsheets contain ‘np’ (not available for publication) annotations. This is due to confidential data being contained in these series.
REVISIONS THIS MONTH
Revisions to the total number of dwelling units approved in this issue are:
| Dwellings | 2016-17 | 2017-18 | TOTAL |
|
| NSW | 406 | 72 | 478 |
| Vic. | -33 | - | -33 |
| Qld | 451 | 28 | 479 |
| SA | 6 | -1 | 5 |
| WA | 17 | 48 | 65 |
| Tas. | 5 | - | 5 |
| NT | - | - | - |
| ACT | - | 12 | 12 |
| Total | 852 | 159 | 1 011 |
|
INQUIRIES
For further information about these and related statistics, contact the National Information and Referral Service on 1300 135 070. The
ABS Privacy Policy outlines how the ABS will handle any personal information that you provide to us.
 Quality Declaration
  Print Page
 Print All