NOTES
ABOUT THIS PUBLICATION
This publication presents information about the types of places where people work with particular focus on people who worked at home.
The statistics in this publication were compiled from the Locations of Work survey. This survey was conducted throughout Australia in November 2005 as a supplement to the Australian Bureau of Statistics (ABS) monthly Labour Force Survey (LFS).
The survey provides information about employed people, aged 15 years and over, who were at work in either their main or second job during the reference week. Further details were collected about their locations of work and the number of locations at which they worked (such as their own home or employer's premises), and the job characteristics and working arrangements of people who worked at home. It also presents information about the use of information technology, leave entitlements and the main reason for working at home. This information can be cross-classified by a range of demographic statistics such as age, sex, martial status and country of birth.
NOTES ABOUT THE ESTIMATES
A number of new data items have been included in this survey. These are 'Hours usually worked in all jobs', 'Hours usually worked at home in main/second/all job/s', 'Use of information technology in job worked at home and in main/second job', 'Whether entitled to paid sick/holiday leave in main/second job', 'Industry in job worked at home and in second job' and 'Occupation in job worked at home and in second job'.
The data items 'Time in job worked at home', 'Basis of payment in job worked at home', 'Main basis of payment in job worked at home', 'Superannuation coverage', 'Workers' compensation coverage', 'Trade union membership' and 'Where work is based in job that travels' used in the 2000 publication are not presented in this publication as this information was not collected in the 2005 survey.
ROUNDING
As estimates have been rounded, discrepancies may occur between sums of the component items and totals.
INQUIRIES
For further information about these and related statistics, contact the National Information and Referral Service on 1300 135 070 or Labour Market Section on Canberra (02) 6252 7206.
CONCEPTUAL FRAMEWORK
CONCEPTUAL FRAMEWORK
The following diagram illustrates the conceptual framework for the 2005 Locations of Work survey. This differs from the conceptual framework used in the 2000 survey. For further information on the differences between the 2000 conceptual framework and the 2005 conceptual framework see paragraphs 22-24 of the Explanatory Notes.
In 2005, employed people who were at work during the reference week were asked about the different types of locations at which they worked, and were classified by whether or not they worked any hours at home in either main or second job during the reference week.
Those who worked more hours at their own home than any other single location in their main or second job, were defined as people who 'worked only or mainly at home in main or second job'.
SUMMARY OF FINDINGS
ALL LOCATIONS OF WORK
In November 2005, there were 9,401,400 employed people at work in their main job, an increase of 9.5% since June 2000. Of these, 24% did at least some work at their own home compared with 20% in June 2000.
Of the employed people at work in their main job in November 2005:
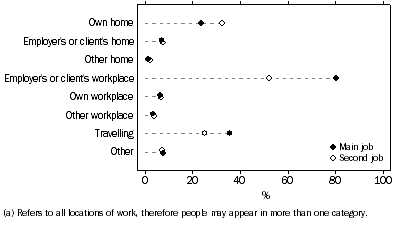
- 80% had worked at their employer's or client's workplace during the reference week, which was similar to June 2000;
- 36% spent time travelling for work compared to 31% in June 2000; and
- 42% had worked in two or more location types in their main job.
Some 560,200 people were multiple jobholders, of which 52% worked at their employer's or client's workplace in their second job. One in three (33%) multiple jobholders worked at their own home in their second job and 25% spent time driving or travelling for work in this job.
Employed persons at work in the reference week, All locations of work(a) - By main and second job

MAIN LOCATION OF WORK
The majority of employed people (81%) at work in the reference week, mainly worked at business premises in their main job (77% of men and 86% of women). Women were more likely than men to have mainly worked at their own home (8.2% and 5.4% respectively) but were less likely than men to have mainly spent time travelling for work (1.7% and 8.2% respectively).
Eighty percent of employed people at work in the reference week were employees. Of these employees, 89% worked at business premises in their main job, while only 1.5% mainly worked at their own home. In contrast, 49% of owner managers mainly worked at business premises and 27% mainly worked at their own home.
Women, who were owner managers of unincorporated enterprises, were most likely to work at their own home (46%) followed by their own/other workplace (27%). In comparison, men, who were owner managers of unincorporated enterprises, were more likely to work at their employer's or client's workplace (22%) or their own/other workplace (22%), followed by another home (21%).
PEOPLE WHO WORKED ANY HOURS AT HOME IN MAIN OR SECOND JOB
Of the employed people at work in November 2005, 25% worked at least some hours at home in either their main or second job. Of these:
- 43% were women compared with 45% of all employed people;
- 77% were 35 years and over compared with 60% of all employed people;
- 40% had children aged less than 15 years compared with 34% of all employed people; and
- 23% of people were born overseas compared with 25% of all employed people.
The proportion of employed people who worked at least some hours at home in their main job, increased from 5.5% of those aged 15-24 to 27% of those aged 35-44 and to 45% of those aged 65 and over.
Employment characteristics
For men, who worked any hours at home in their main or second job, the most common occupation groups in their job at home were Professionals (31%), Managers and administrators (24%), and Associate professionals (15%). The most common occupation groups for women, in their job at home, were Professionals (38%), Advanced clerical and service workers (15%), Intermediate clerical, sales and service workers (13%), Associate Professionals (13%) and Managers and Administrators (13%).
In November 2005, 17% of people who worked any hours at home in their main or second job, worked in the Property and business services industry in their job at home, followed by Education (16%), and Construction (11%).
Other characteristics of people who worked any hours at home in their main or second job include:
- 75% were full-time workers;
- 35% reported that their main reason for doing some work at home was to catch up on work;
- 23% reported that their main reason for doing some work at home was 'wanted office at home/no overheads/no rent';
- 73% of people had an arrangement to work at home;
- 81% of people used information technology at home in that job; and
- 86% of people who used information technology at home used both the computer and internet, 13% used only a computer and the remainder (0.6%) used the internet only.
PEOPLE WHO WORKED ONLY OR MAINLY AT HOME IN MAIN OR SECOND JOB
There were 724,500 people who worked only or mainly at home in their main or second job (7.7% of all employed people at work) in November 2005. Of these:
- 55% were women;
- 79% were 35 years and over; and
- 40% had children aged less than 15 years.
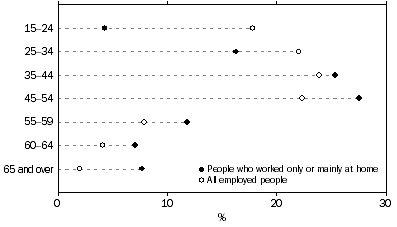
Of the people who worked only or mainly at home, 28% were aged between 45-54 compared with 22% of all employed people and 16% were aged between 25-34, compared with 22% of all employed people.
AGE GROUP, People who worked only or mainly at home and all employed people

Employment characteristics
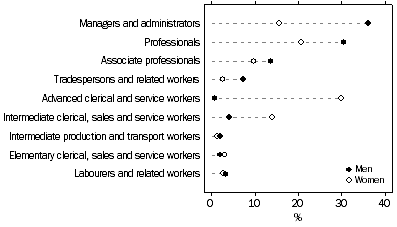
For men, who worked only or mainly at home, the most common occupation groups in their job at home were Managers and administrators (36%), Professionals (31%) and Associate professionals (14%). The most common occupation groups for women, in their job at home, were Advanced clerical and service workers (30%), Professionals (21%) and Managers and administrators (16%).
PEOPLE EMPLOYED AT HOME, Occupation in job worked at home - By sex

Other characteristics of people who worked only or mainly at home include:
- 95% had an arrangement to work at home;
- 40% reported that their main reason for working from home was 'wanted office at home/no overheads/no rent'; and
- 72% worked less than 35 hours at home in all jobs.
SINGLE AND MULTIPLE JOBHOLDERS
Just under one-quarter (23%) of single jobholders did at least some work at home in their job. Of these, 34% worked 50 hours or more in their job. In contrast to single jobholders, 30% of multiple jobholders did some work at home in their main job. Of these, 23% worked 50 hours or more in their main job.
Characteristics of single jobholders include:
- 62% worked 35 hours or more, of which 26% worked at least some hours at home;
- 12% were owner managers of unincorporated enterprises; and
- 80% were employees, of which 76% had leave entitlements.
Characteristics of multiple jobholders' main job include:
- 42% worked 35 hours or more, of which 36% worked at least some hours at home;
- 14% were owner managers of unincorporated enterprises; and
- 77% were employees, of which 63% had leave entitlements.
In contrast, characteristics of multiple jobholders' second job include:
- 3.1% worked 35 hours or more, of which 52% worked at least some hours at home;
- 25% were owner managers of unincorporated enterprises; and
- 56% were employees, of which 22% had leave entitlements.
 Print Page
 Print All