SEPTEMBER KEY FIGURES
 | | September 2016 | August 2016 to September 2016 |
| | $m | % change |
|
| Turnover at current prices | | |
| Trend | 25 223.4 | 0.2 |
| Seasonally Adjusted | 25 314.1 | 0.6 |
|
| | September Qtr 2016 | June Qtr 2016 to September Qtr 2016 |
| | $m | % change |
|
| Turnover in volume terms | | |
| Trend | 73 998.5 | 0.2 |
| Seasonally Adjusted | 73 880.2 | -0.1 |
|
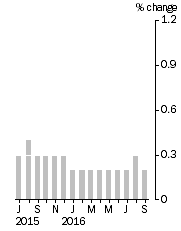
Monthly Turnover, Current Prices - Trend Estimate
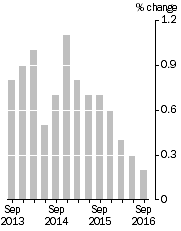
| Quarterly Turnover, in volume terms - Trend estimate
|
SEPTEMBER KEY POINTS
CURRENT PRICES
- The trend estimate rose 0.2% in September 2016. This follows a rise of 0.3% in August 2016 and a rise of 0.2% in July 2016.
- The seasonally adjusted estimate rose 0.6% in September 2016. This follows a rise of 0.5% in August 2016 and a relatively unchanged estimate (0.0%) in July 2016.
- In trend terms, Australian turnover rose 2.8% in September 2016 compared with September 2015.
- The following industries rose in trend terms in September 2016: Cafes, restaurants and takeaway food services (0.9%), Food retailing (0.2%), Household goods retailing (0.2%) and Clothing, footwear and personal accessory retailing (0.2%). Other retailing (0.0%) was relatively unchanged. Department stores (-0.3%) fell in trend terms in September 2016.
- The following states and territories rose in trend terms in September 2016: Queensland (0.6%), New South Wales (0.2%), Victoria (0.2%), South Australia (0.3%), the Australian Capital Territory (0.4%) and Tasmania (0.1%). Western Australia (-0.1%) and the Northern Territory (-0.1%) fell in trend terms in September 2016.
VOLUME MEASURES
- In volume terms, the trend estimate for Australian turnover rose 0.2% in the September quarter 2016.
NOTES
FORTHCOMING ISSUES
| ISSUE | Release Date |
| October 2016 | 2 December 2016 |
| November 2016 | 10 January 2017 |
| December 2016 | 6 February 2017 |
| January 2017 | 6 March 2017 |
| February 2017 | 3 April 2017 |
| March 2017 | 9 May 2017 |
CHANGES IN THIS ISSUE
This issue includes updated quarterly measures of total retail turnover per capita. The full time series is available from the Downloads tab of this publication on the ABS website.
Updated online retail turnover estimates for the September 2016 reference month are provided and explained within the appendix section of this publication.
REVISIONS
There are no revisions to the original estimates. Revisions to seasonally adjusted estimates are due to the concurrent methodology for deriving seasonal factors. For information on seasonal adjustment and trend estimation please refer to the explanatory notes of this publication.
TIME SERIES DATA
Data available from the Downloads tab of this issue on the ABS website include longer time series of tables in this publication:
- Monthly retail turnover by state and 15 industry subgroups in trend, seasonally adjusted and original terms
- Monthly retail turnover completely enumerated and sample sectors, by six industry groups and also by state in original terms
- Monthly retail turnover completely enumerated sector, total level in trend, seasonally adjusted and original terms
- Quarterly retail chain volume measures by six industry groups and also by state in trend, seasonally adjusted and original terms
- Quarterly retail turnover per capita in trend, seasonally adjusted and original terms
- Quarterly sales to households by selected service industries in original terms.
INQUIRIES
Inquiries about these and related statistics, contact the National Information and Referral Service on 1300 135 070. The ABS Privacy Policy outlines how the ABS will handle any personal information that you provide to us.
 Print Page
 Print All