SEPTEMBER KEY FIGURES
 | July 2006 | August 2006 | September 2006 | Aug 06 to Sep 06 |  |
 | $m | $m | $m | % change |  |
TREND |  |
|  |
| Balance on goods and services | -686 | -578 | -407 | . . |  |
| Credits (exports of goods & services) | 17 837 | 17 900 | 17 981 | - |  |
| Debits (imports of goods & services) | 18 523 | 18 478 | 18 388 | - |  |
SEASONALLY ADJUSTED |  |
|  |
| Balance on goods and services | -382 | -324 | -646 | . . |  |
| Credits (exports of goods & services) | 17 786 | 17 961 | 17 692 | -1 |  |
| Debits (imports of goods & services) | 18 168 | 18 285 | 18 338 | - |  |
|  |
| . . not applicable |
| - nil or rounded to zero (including null cells) |
Balance on goods and services
|  |
SEPTEMBER KEY POINTS
TREND ESTIMATES
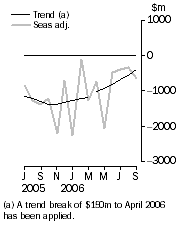
- The provisional trend estimate of the balance on goods and services was a deficit of $407m in September 2006, a decrease of $171m on the revised deficit in August.
- Goods and services credits rose $81m to $17,981m. Goods and services debits fell $90m to $18,388m.
SEASONALLY ADJUSTED ESTIMATES
- In seasonally adjusted terms, the balance on goods and services was a deficit of $646m in September, an increase of $322m on the revised deficit in August.
- Goods and services credits fell $269m (1%) to $17,692m. Non-rural and other goods fell $297m (2%) and rural goods fell $18m (1%). Services credits rose $46m (1%).
- Goods and services debits rose $53m to $18,338m. Intermediate and other goods rose $71m (1%), capital goods rose $19m (1%), while consumption goods fell $51m (1%). Services debits rose $14m.
ORIGINAL ESTIMATES
- In original terms, the September balance on goods and services was a deficit of $1,274m, an increase of $473m on the revised deficit in August. Goods and services credits fell $258m (1%) while goods and services debits rose $215m (1%).
- In the three months to September, exports of non-rural and other goods were up $6.3b (21%) and rural goods were up $0.6b (9%) on the corresponding period in 2005-06.
NOTES
FORTHCOMING ISSUES
| ISSUE | Release Date |
| October 2006 | 29 November 2006 |
| November 2006 | 10 January 2007 |
| December 2006 | 2 February 2007 |
| January 2007 | 6 March 2007 |
| February 2007 | 3 April 2007 |
| March 2007 | 4 May 2007 |
REVISIONS
Revisions were made to incorporate the latest available data relating to merchandise trade and the latest administrative data available for international trade in services. In original terms, these revisions have:
- increased the deficit on goods and services for August 2006 by $68m
- increased the deficit on goods and services for 2005-06 by $42m.
CHANGES TO THIS ISSUE
Preliminary goods debits chain volume measures and price outcomes
Details of preliminary goods debits chain volume measures and price outcomes could not be provided in time for the release of this issue. These details will be available from the ABS web site on 16 November 2006 as Additional Information on the summary tab to this publication.
CHANGES TO SEASONAL ADJUSTMENT
Details of the annual seasonal re-analysis of the monthly series presented in this publication and an explanation of a modified approach to seasonal adjustment for the quarterly Balance of Payment series are as follows:
Annual seasonal re-analysis
Seasonally adjusted and trend monthly goods and services estimates have been revised as a result of the annual seasonal re-analysis, which reviews the seasonal and trading day factors in more detail than possible in the monthly processing cycle.
The re-analysis has changed the treatment of non-monetary gold credits and repairs on goods debits. Clients should refer to footnotes attached to each seasonally adjusted table.
This re-analysis has slightly changed the seasonally adjusted movement between August and September 2006 for goods imports (debits) from a preliminary increase of 0.4% advised in the September 2006 issue of International Merchandise Imports, Australia (cat. no. 5439.0) to an increase of 0.3% in this issue.
Implementation of trading day adjustment in quarterly series
The ABS is modifying the seasonal adjustment processes applied to quarterly Balance of Payments data to better account for trading day variations. A brief explanation of this modified approach is provided below.
Seasonally adjusted estimates are derived by estimating and removing systematic calendar related effects from the original series. In the balance of payments series, these calendar related effects are known as seasonal influences (e.g. increased imports in the lead-up to Christmas) and trading day influences (arising from the varying length of each month and the varying number of Sundays, Mondays, Tuesdays, etc. in each month). Each influence is estimated by separate seasonal and trading day factors which, when combined, are referred to as the combined adjustment factors.
Trading day, or working day patterns, are purely calendar related behaviour which arise when more activity tends to occur on some days of the week than on others. With monthly series for example, the number of times a particular day of the week occurs in a given month depends on the number of days in the month, and the way the days of the week fall in that month for that year. Thus the different days of the week can occur with different frequencies from month to month and year to year. If more activity tends to occur on some days of the week than on others, the changing frequency of particular days from month to month will have an impact on the behaviour of the original monthly series. The result is a systematic pattern of behaviour which is independent of monthly changes in underlying activity. This effect is termed the trading day effect. The trading day effect is relatively easy to isolate in monthly series because each month generally contains four weeks plus two or three days. The effect of the two or three extra days over four weeks can be quite significant.
However, directly estimating the trading day effect in a quarterly series is difficult because a quarter generally contains 13 weeks plus or minus only one day. An alternative involves applying the trading day variation derived from the corresponding monthly series, which contain more information on trading day activity and is considered a superior methodology. From the September quarter 2006 issue of Balance of Payments and International Investment Position, Australia (cat. no. 5302.0), this alternate treatment of trading day variation will be applied to the seasonally adjusted quarterly balance of payments series. As a result, revisions will occur for all previously published seasonally adjusted and trend estimates. These revisions will improve both the historical series and future series.
These changes will also improve the observed coherence between quarterly seasonally adjusted estimates and the sum of the corresponding monthly series. The ABS is investigating other options for improving this coherence.
AVAILABILITY OF DETAILED SERVICES DATA
International Trade in Services data cubes
The financial year trade in services data cubes associated with this issue, by state and by detailed service, have been updated to incorporate historical revisions at the total level released in the August issue of this publication. The financial year country data cubes will be updated with the October issue of this publication. The calendar year data, which are normally updated with the March issue of this publication, will be updated to reflect these revisions as soon as practical, possibly with the November issue.
FEATURE ARTICLE
A feature article, Number and Characteristics of Australian Exporters, 2005-06 (cat. no. 5368.0.55.006) was released on 24 October 2006.
INQUIRIES
For further information about these and related statistics, contact the National Information and Referral Service on 1300 135 070 or Tom Jebbink on Canberra (02) 6252 5540.
ANALYSIS AND COMMENTS
BALANCE ON GOODS AND SERVICES
The trend estimate of the balance on goods and services in September 2006 was a deficit of $407m, a decrease of $171m on the deficit in August.
In seasonally adjusted terms, the balance on goods and services in September 2006 was a deficit of $646m, an increase of $322m on the deficit in August.
The sum of the seasonally adjusted balances for the three months to September 2006 was a deficit of $1,352m, a decrease of $1,918m on the deficit of $3,270m for the three months to June 2006. However, if the seasonal factors (based on the modified approach described on page 4) used in compiling quarterly Balance of Payments are applied, the September quarter 2006 deficit was $1,271m, a decrease of $2,058m on the revised June quarter 2006 deficit of $3,329m.
EXPORTS OF GOODS AND SERVICES
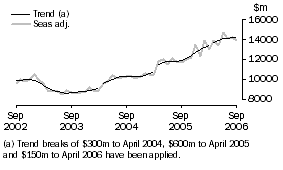
The trend estimate of goods and services credits rose $81m between August and September to $17,981m.
In seasonally adjusted terms, goods and services credits fell $269m (1%) to $17,692m. Non-rural goods fell $195m (2%), other goods fell $102m (10%) and rural goods fell $18m (1%). Services credits rose $46m (1%).
Exports of goods
GOODS CREDITS
RURAL GOODS
The trend estimate of rural goods exports rose $11m to $2,231m.
In seasonally adjusted terms, exports of rural goods fell $18m (1%) to $2,232m.
The seasonally adjusted components contributing to this fall were:
- other rural, down $21m (2%)
- cereal grains and cereal preparations, down $12m (2%)
- meat and meat preparations, down $6m (1%).
Partly offsetting these effects was wool and sheepskins, up $21m (11%).
In original terms, exports of rural goods rose $30m (1%) to $2,283m.
NON-RURAL GOODS
The trend estimate of non-rural goods exports rose $96m (1%) to $10,944m.
In seasonally adjusted terms, exports of non-rural goods fell $195m (2%) to $10,722m.
The seasonally adjusted components contributing to the fall were:
- coal, coke and briquettes, down $152m (8%), largely due a fall in volumes of coal exports
- transport equipment, down $68m (16%)
- metals (excl. non-monetary gold), down $44m (4%)
- metal ores and minerals, down $20m (1%).
Partly offsetting these effects were:
- other non-rural, up $69m (6%)
- other mineral fuels, up $11m (1%).
In original terms, exports of non-rural goods rose $3m to $11,046m.
OTHER GOODS
The trend estimate of other goods exports fell $51m (5%) to $1,057m.
In seasonally adjusted terms, exports of other goods fell $102m (10%) to $968m.
The main component contributing to the fall in the seasonally adjusted series was non-monetary gold, down $115m (12%).
In original terms, exports of other goods fell $110m (10%) to $977m.
Exports of services
SERVICES CREDITS
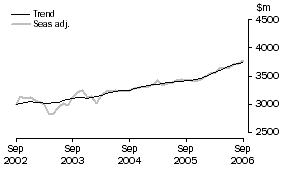
In trend terms, services credits rose $25m (1%) to $3,749m.
Seasonally adjusted, services credits rose $46m (1%) to $3,770m.
All components contributed to the rise in the seasonally adjusted series with:
- travel services, up $33m (2%)
- other services, up $10m (1%)
- transportation services, up $3m.
Seasonally adjusted, tourism related services credits rose $40m (2%) to $2,407m.
IMPORTS OF GOODS AND SERVICES
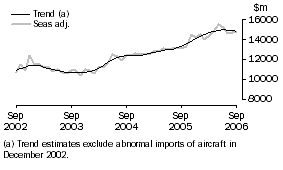
The trend estimate of goods and services debits fell $90m between August and September to $18,388m.
In seasonally adjusted terms, goods and services debits rose $53m to $18,338m. Other goods rose $133m (30%) and capital goods rose $19m (1%), while intermediate and other merchandise goods fell $62m (1%) and consumption goods fell $51m (1%). Services debits rose $14m.
Imports of goods
GOODS DEBITS
CONSUMPTION GOODS
The trend estimate of imports of consumption goods fell $2m to $4,412m.
In seasonally adjusted terms, imports of consumption goods fell $51m (1%) to $4,362m.
The main component contributing to the fall in the seasonally adjusted estimates was non-industrial transport equipment, down $80m (7%).
Partly offsetting this effect were:
- consumption goods n.e.s., up $21m (2%)
- textiles, clothing and footwear, up $8m (1%).
In original terms, imports of consumption goods rose $48m (1%) to $4,812m.
CAPITAL GOODS
The trend estimate of imports of capital goods fell $48m (1%) to $3,178m.
In seasonally adjusted terms, imports of capital goods rose $19m (1%) to $3,256m.
The main components contributing to the rise in the seasonally adjusted estimates were:
- capital goods n.e.s., up $64m (15%)
- industrial transport equipment n.e.s., up $58m (13%)
- telecommunications equipment, up $51m (13%).
Largely offsetting these effects were:
- civil aircraft, down $114m
- machinery and industrial equipment, down $48m (4%).
In original terms, imports of capital goods fell $85m (3%) to $3,299m.
INTERMEDIATE AND OTHER MERCHANDISE GOODS
The trend estimate of imports of intermediate and other merchandise goods rose $10m to $6,609m.
In seasonally adjusted terms, imports of intermediate and other merchandise goods fell $62m (1%) to $6,536m.
The main components contributing to the fall in the seasonally adjusted estimates were:
- fuels and lubricants, down $187m (10%), with crude petroleum imports down 4% in both volume and price
- primary industrial supplies n.e.s., down $25m (20%).
Partly offsetting these effects were:
- other merchandise goods, up $53m (62%)
- processed industrial supplies n.e.s., up $37m (3%)
- iron and steel, up $21m (8%)
- other parts for capital goods, up $19m (2%).
In original terms, imports of intermediate and other merchandise goods fell $232m (3%) to $6,607m.
OTHER GOODS
The trend estimate of imports of other goods fell $60m (9%) to $586m.
In both original and seasonally adjusted terms, other goods imports rose $133m (30%) to $580m.
The component contributing to the rise in the estimates was non-monetary gold, up $197m (85%). This was partly offset by a fall in goods for processing, down $66m to $1m.
Imports of services
SERVICES DEBITS
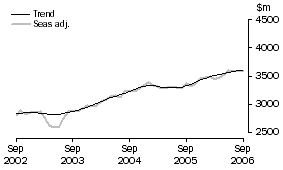
In trend terms, services debits rose $10m to $3,603m.
Seasonally adjusted, services debits rose $14m to $3,604m.
The components contributing to the rise in the seasonally adjusted estimates were:
- travel services, up $20m (2%)
- other services, up $6m (1%).
Partly offsetting these effects was transportation services, down $12m (1%).
Seasonally adjusted, tourism related services debits rose $59m (3%) to $1,923m.
 Print Page
 Print All