DECEMBER KEY FIGURES
 | Trend estimates
| Seasonally adjusted estimates
| |
| Dec 2004 | Nov 2004 to Dec 2004 | Dec 2004 | Nov 2004 to Dec 2004 | |
| |
| Value of dwelling commitments(a) | $m | % change | $m | % change | |
| Total dwellings | 16,429 | 1.5 | 16,858 | 2.8 | |
| Owner occupied housing | 10,808 | 1.4 | 11,018 | 2.8 | |
| Investment housing - fixed loans(b) | 5,621 | 1.7 | 5,840 | 2.9 | |
| Number of dwelling commitments(a) | no. | % change | no. | % change | |
| Owner occupied housing | 51,438 | 0.9 | 51,931 | 1.2 | |
| Construction of dwellings | 4,682 | -0.1 | 4,634 | -1.7 | |
| Purchase of new dwellings | 1,970 | 0.9 | 2,002 | 3.6 | |
| Purchase of established dwellings | 44,786 | 1.0 | 45,295 | 1.4 | |
| |
| (a) Includes refinancing. |
| (b) Excludes revolving credit. |
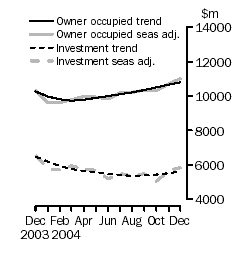
Housing finance, Value of dwellings
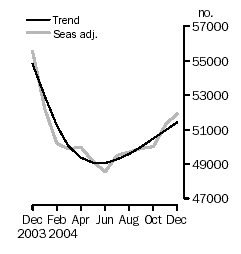
| Owner occupied housing finance, Number of dwellings
|
DECEMBER KEY POINTS
TREND ESTIMATES
- Total value of dwelling finance commitments increased by 1.5% in December 2004, the eighth consecutive monthly increase. Owner occupied housing increased by 1.4%, the ninth consecutive monthly increase. Investment housing rose by 1.7%, the fourth monthly increase following eleven consecutive months of decreasing commitments.
- The number of housing finance commitments for owner occupation increased by 0.9% in December 2004, while the number excluding refinancing rose by 1.2%.
SEASONALLY ADJUSTED ESTIMATES
- Total value of housing finance commitments rose by 2.8% in December 2004, the second consecutive monthly increase.
- Investment housing commitments increased by 2.9%, driven primarily by an increase in the purchase of dwellings for rent or resale by individuals (up 5.4%). Owner occupied housing commitments increased by 2.8%.
- The number of housing finance commitments for owner occupied housing increased by 1.2% in December 2004, the sixth consecutive monthly increase. The number excluding refinancing increased by 1.1%.
ORIGINAL ESTIMATES
- First home buyer commitments as a percentage of total commitments rose to 16.6% in December 2004.
NOTES
EXPECTED CHANGES
Introduction of New Accounting Standards
The introduction of new accounting standards for businesses and government will occur over the period from 1 January 2005 to 31 December 2006. These standards may have impacts on data reported to the ABS. The changes will be introduced by business and government in accordance with their external reporting cycles, and thus there is no single cutover date. The ABS is preparing an information paper expected for publication by end of February which discusses the changes and the potential impacts on ABS statistics.
The series published in this publication are compiled in accordance with statistical standards, not accounting standards. In principle, therefore, there should be no breaks in series as a result the introduction of new accounting standards. In practice, the ABS expects that some data reported will change, and additional data quality assurance measures have been introduced to identify such cases. When a significant change is identified, the ABS will discuss the nature of the change with the data providers, and where necessary, make adjustments on the basis of advice received. Where such adjustments are made, their nature and size will be noted on page 2 "changes this issue".
For this release there were no identified impacts or adjustments made.
Expected revisions
Following consultation with a number of data providers, revisions to a number of series in this publication have been advised to the ABS. We intend to incorporate these revisions into published statistics next month. These revisions will affect estimates of the levels of housing finance, but are unlikely to cause significant changes to percentage movements for key series.
INQUIRIES
For further information about these and related statistics, contact the National Information and Referral Service on 1300 135 070 or Darren Page on (02) 6252 6731.
SUMMARY COMMENTARY
SUMMARY OF FINDINGS
DWELLINGS FINANCED
Value of Dwellings Financed
The total value of dwelling commitments excluding alterations and additions (seasonally adjusted) increased by 2.8% in December 2004. The total housing finance trend increased by 1.5%, the eighth consecutive month of slight increases.
The total value of owner occupied commitments (seasonally adjusted) increased by 2.8% (up $299m) in December 2004, the second consecutive monthly increase. Increases in the purchase of established dwellings excluding refinancing (up $202m, 3.1%) and refinancing of established dwellings (up $74m, 2.6%) were the major contributors to the increase in total value of owner occupied commitments. The trend series in the value of owner occupied commitments rose by 1.4% in December.
The seasonally adjusted series for value of investment housing commitments (including finance for construction and finance for rent or resale) increased by 2.9% (up $165m) in December 2004, a second monthly increase following a fall of 8.0% in October. The increase this month was due to an increase in purchase of dwellings for rent or resale by individuals (up $246m, 5.4%) which was partly offset by decreases in finance for the construction of dwellings for rent or resale (down $67m, -10.7%) and purchase of dwellings for rent or resale by others (down $13m, -2.7%). The trend series in total value of investment commitments rose by 1.7%.
INVESTMENT HOUSING - TOTAL
Number of Owner Occupied Dwellings Financed
The number of owner occupied dwelling commitments (seasonally adjusted) increased by 1.2% in December 2004, the sixth consecutive monthly increase. Increases in the purchase of established dwellings excluding refinancing (up 406, 1.4%), refinancing of established dwellings (up 204, 1.4%) and purchase of new dwellings (up 70, 3.6%) more than offset the decrease in construction of dwellings (down 81, -1.7%).
The trend estimate for total number of owner occupied housing finance commitments rose by 0.9% in December 2004, the sixth consecutive monthly increase.
Increases were recorded in seasonally adjusted terms in New South Wales (up 486, 3.2%), Queensland (up 99, 1.0%), Tasmania (up 54, 5.6%), Northern Territory (up 33, 5.9%) and Australian Capital Territory (up 23, 4.0%). These increases were partially offset by falls in Western Australia (down 83, -1.1%) and South Australia (down 35, -0.8%). Commitments in Victoria remained virtually unchanged (up 2, 0%). The trend increased in all states and territories except Tasmania and Australian Capital Territory.
In original terms, first home buyer commitments as a percentage of total owner occupied housing commitments rose to 16.6% in December 2004. The percentage of commitments at a fixed rate of interest (for at least two years) decreased to 9.9% in December, following four consecutive increases.
Number of Owner Occupied Dwellings Financed Excluding Refinancing
The number of owner occupied dwellings financed excluding refinancing (seasonally adjusted) increased by 1.1% in December 2004, after a 4.0% increase in November. The trend increased by 1.2% in December 2004, the seventh consecutive monthly increase.
PURPOSE OF FINANCE (OWNER OCCUPATION)
Construction of dwellings
The seasonally adjusted number of construction commitments for owner occupation fell by 1.7% in December 2004, the second consecutive monthly decrease. The trend series decreased slightly by 0.1% in December, continuing its decline since August 2003 but at a decelerating rate for the seventh successive month.
Purchase of new dwellings
The number of finance commitments for the purchase of new dwellings for owner occupation (seasonally adjusted) rose by 3.6% in December 2004, following a decrease of 0.2% in November. The trend series rose 0.9% in December 2004.
Purchase of established dwellings
The seasonally adjusted established dwelling for owner occupation series increased by 1.4% in December 2004, after a 3.0% increase in November. The trend rose by 1.0% in December 2004, the seventh consecutive monthly increase.
Refinancing
The number of refinancing commitments for owner occupied housing (seasonally adjusted) increased by 1.4% in December 2004, after a fall of 0.7% in November. The trend series increased by 0.2% in December, the sixth consecutive month of slight increases.
TYPE OF LENDER (OWNER OCCUPATION)
Banks
The number of owner occupied dwellings financed by banks (seasonally adjusted) increased by 0.7% in December 2004, after an rise of 2.7% in November. The trend series increased by 0.8% in December, the seventh consecutive month of small increases.
Non-banks
Non-bank commitments for owner occupied housing (seasonally adjusted) increased by 2.5% in December 2004, the sixth consecutive monthly increase. Wholesale lenders were up 6.4% while permanent building societies were down 3.0%. The non-bank trend series increased by 1.2% in December 2004, the sixth consecutive monthly increase.
HOUSING LOAN OUTSTANDINGS
At the end of December 2004, housing loans outstanding of authorised deposit-taking institutions was $497,408m, up $6,816m (1.4%) from November's closing balance. Owner occupied housing loans increased by $5,093m (1.6%) to close at $331,229m, while investment housing loans outstanding increased by $1,723m (1.0%) to reach a closing balance of $166,179m.
Bank loans increased by $6,595m (1.4%) during December to a closing stock of $468,099m. Owner occupied housing loans of banks increased by $4,850m (1.6%) to $307,761m, while investment housing loans increased $1,745m (1.1%) to $160,338m.
 Print Page
 Print All