(a) Seasonally adjusted numbers of new motor vehicle sales in Tasmania, Northern Territory and Australian Capital Territory should be used with caution. For more information, see paragraph 7 of the Explanatory Notes.
MAY KEY POINTS
TOTAL NEW MOTOR VEHICLE SALES
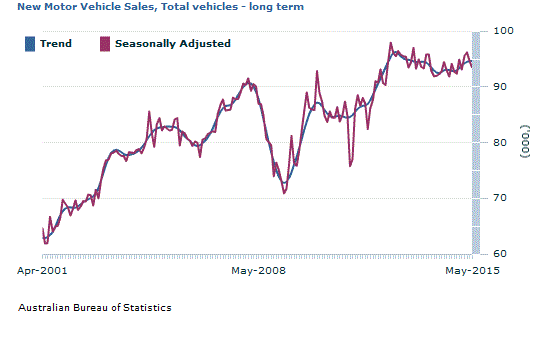
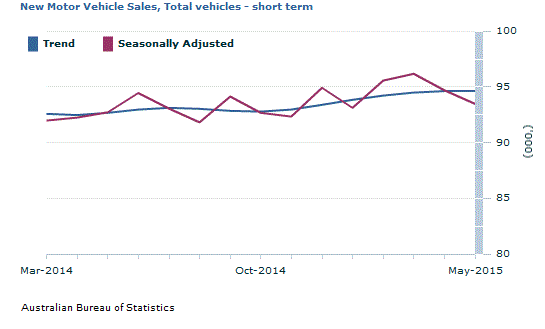
Trend estimates: The May 2015 trend estimate (94 636) has increased by 16 units (0.0%) when compared with April 2015.
Seasonally adjusted estimates: The May 2015 seasonally adjusted estimate (93 479) has decreased by 1.3% when compared with April 2015.
SALES BY TYPE OF VEHICLE
Trend estimates: When comparing national trend estimates for May 2015 with April 2015, sales of Sports utility and Other vehicles increased by 0.8% and 9 units (0.0%) respectively. Over the same period, Passenger vehicles decreased by 0.6%.
Seasonally adjusted estimates: When comparing seasonally adjusted estimates for May 2015 with April 2015, sales of Sports utility and Other vehicles decreased by 6.1% and 0.2% respectively. Over the same period, Passenger vehicles increased by 2.2%.
SALES BY STATE
Trend estimates: Four of the eight states and territories experienced an increase in new motor vehicle sales when comparing May 2015 with April 2015. The Northern Territory recorded the largest percentage increase (0.9%), followed by New South Wales (0.4%) and both Queensland and Tasmania (0.1%). Over the same period, Western Australia recorded the largest decrease in sales (0.8%).
Seasonally adjusted estimates: Six of the states and territories experienced a decrease in new motor vehicle sales when comparing May 2015 with April 2015. Victoria recorded the largest percentage decrease (4.0%) followed by South Australia (3.2%) and both Western Australia and Tasmania (2.0%). Over the same period, New South Wales recorded the largest increase in sales (1.9%).
SUMMARY COMMENTARY
Footnote(s): Break in time series for trend between June and July 2000. See paragraph 13 of the Expanatory Notes.
New motor vehicle sales by type of vehicle by month
Passenger vehicles
Sports utility vehicles
Other vehicles
Total vehicles
Change Passenger vehicles
Change Sports utility vehicles
Change Other vehicles
Change Total vehicles
no.
no.
no.
no.
%
%
%
%
Trend
2014
March
45 261
28 410
18 898
92 570
-1.1
0.7
-0.2
-0.4
April
44 843
28 683
18 944
92 469
-0.9
1.0
0.2
-0.1
May
44 572
29 035
19 051
92 658
-0.6
1.2
0.6
0.2
June
44 402
29 411
19 138
92 951
-0.4
1.3
0.5
0.3
July
44 207
29 740
19 161
93 107
-0.4
1.1
0.1
0.2
August
43 944
29 944
19 135
93 023
-0.6
0.7
-0.1
-0.1
September
43 629
30 115
19 108
92 852
-0.7
0.6
-0.1
-0.2
October
43 368
30 296
19 122
92 786
-0.6
0.6
0.1
-0.1
November
43 215
30 550
19 205
92 970
-0.4
0.8
0.4
0.2
December
43 113
30 931
19 332
93 377
-0.2
1.2
0.7
0.4
2015
January
43 016
31 406
19 417
93 839
-0.2
1.5
0.4
0.5
February
42 851
31 914
19 448
94 213
-0.4
1.6
0.2
0.4
March
42 615
32 397
19 466
94 478
-0.6
1.5
0.1
0.3
April
42 340
32 803
19 476
94 620
-0.6
1.3
0.1
0.1
May
42 080
33 071
19 485
94 636
-0.6
0.8
-
-
Seasonally Adjusted
2014
March
44 279
29 078
18 619
91 976
-4.0
8.3
-1.4
0.1
April
45 342
28 542
18 365
92 249
2.4
-1.8
-1.4
0.3
May
44 153
29 401
19 162
92 716
-2.6
3.0
4.3
0.5
June
44 647
29 312
20 480
94 439
1.1
-0.3
6.9
1.9
July
44 513
30 013
18 531
93 056
-0.3
2.4
-9.5
-1.5
August
43 746
29 202
18 879
91 827
-1.7
-2.7
1.9
-1.3
September
43 793
31 206
19 129
94 128
0.1
6.9
1.3
2.5
October
43 449
30 060
19 162
92 672
-0.8
-3.7
0.2
-1.5
November
42 993
30 567
18 773
92 332
-1.1
1.7
-2.0
-0.4
December
44 108
30 780
20 020
94 908
2.6
0.7
6.6
2.8
2015
January
43 547
30 250
19 309
93 107
-1.3
-1.7
-3.5
-1.9
February
43 072
33 255
19 242
95 569
-1.1
9.9
-0.3
2.6
March
44 896
31 698
19 576
96 169
4.2
-4.7
1.7
0.6
April
41 033
34 175
19 475
94 683
-8.6
7.8
-0.5
-1.5
May
41 941
32 106
19 433
93 479
2.2
-6.1
-0.2
-1.3
Original
2014
March
47 079
30 778
19 410
97 267
7.9
19.0
12.2
12.0
April
39 027
25 350
16 333
80 710
-17.1
-17.6
-15.9
-17.0
May
43 819
30 730
20 013
94 562
12.3
21.2
22.5
17.2
June
53 844
36 846
27 619
118 309
22.9
19.9
38.0
25.1
July
43 464
28 805
17 598
89 867
-19.3
-21.8
-36.3
-24.0
August
42 658
27 543
17 956
88 157
-1.9
-4.4
2.0
-1.9
September
45 194
30 027
19 757
94 978
5.9
9.0
10.0
7.7
October
43 126
28 835
19 275
91 236
-4.6
-4.0
-2.4
-3.9
November
43 063
31 032
18 137
92 232
-0.1
7.6
-5.9
1.1
December
45 051
30 666
21 092
96 809
4.6
-1.2
16.3
5.0
2015
January
39 799
27 679
14 638
82 116
-11.7
-9.7
-30.6
-15.2
February
40 775
32 039
17 610
90 424
2.5
15.8
20.3
10.1
March
48 185
35 503
21 366
105 054
18.2
10.8
21.3
16.2
April
35 015
29 664
16 977
81 656
-27.3
-16.4
-20.5
-22.3
May
40 592
32 530
20 205
93 327
15.9
9.7
19.0
14.3
- nil or rounded to zero (including null cells)
New motor vehicle sales by state/territory of registration
NSW
Vic.
Qld
SA
WA
Tas.(a)
NT(a)
ACT(a)
Aust.
no.
no.
no.
no.
no.
no.
no.
no.
no.
Trend
2014
March
29 370
24 841
18 809
5 819
9 866
1 497
927
1 443
92 570
April
29 300
24 955
18 653
5 828
9 909
1 469
929
1 427
92 469
May
29 364
25 161
18 544
5 848
9 933
1 451
927
1 428
92 658
June
29 548
25 348
18 472
5 870
9 912
1 440
920
1 443
92 951
July
29 768
25 443
18 398
5 875
9 827
1 430
911
1 456
93 107
August
29 942
25 476
18 299
5 849
9 678
1 419
901
1 459
93 023
September
30 052
25 496
18 231
5 807
9 504
1 417
896
1 449
92 852
October
30 130
25 528
18 255
5 767
9 341
1 431
898
1 435
92 786
November
30 192
25 609
18 403
5 750
9 220
1 463
905
1 428
92 970
December
30 253
25 736
18 640
5 761
9 138
1 502
914
1 433
93 377
2015
January
30 331
25 845
18 896
5 784
9 073
1 538
927
1 445
93 839
February
30 430
25 906
19 110
5 800
9 006
1 566
938
1 457
94 213
March
30 554
25 933
19 260
5 800
8 935
1 585
948
1 464
94 478
April
30 675
25 933
19 350
5 783
8 861
1 594
958
1 466
94 620
May
30 806
25 887
19 372
5 756
8 791
1 595
966
1 462
94 636
Seasonally Adjusted
2014
March
28 884
25 110
18 500
5 927
9 785
1 477
885
1 408
91 976
April
29 363
24 533
18 766
5 724
9 930
1 493
1 042
1 399
92 249
May
29 281
25 472
18 474
5 784
10 007
1 460
834
1 404
92 716
June
29 909
25 731
18 734
6 019
10 096
1 509
978
1 463
94 439
July
29 660
25 574
18 293
5 824
9 841
1 456
913
1 494
93 056
August
29 678
25 184
18 020
5 844
9 393
1 396
859
1 452
91 827
September
30 269
25 399
18 860
5 889
9 727
1 599
903
1 482
94 128
October
30 478
25 318
18 008
5 750
9 362
1 437
905
1 412
92 672
November
29 847
25 912
17 954
5 761
9 112
1 428
897
1 421
92 332
December
30 372
25 882
20 313
5 557
9 036
1 405
954
1 389
94 908
2015
January
30 004
25 611
18 922
5 695
9 003
1 593
844
1 435
93 107
February
30 637
25 715
19 746
6 152
9 170
1 652
1 009
1 488
95 569
March
30 706
26 182
20 401
5 765
9 070
1 594
924
1 528
96 169
April
30 414
26 402
19 323
5 777
8 793
1 569
964
1 441
94 683
May
30 993
25 347
19 004
5 595
8 618
1 539
967
1 417
93 479
Original
2014
March
30 656
26 311
20 073
6 184
10 117
1 457
998
1 471
97 267
April
25 625
21 108
17 041
4 897
8 604
1 182
1 070
1 183
80 710
May
29 788
26 042
19 252
5 764
9 920
1 409
978
1 409
94 562
June
37 575
31 327
24 643
7 531
12 440
1 743
1 258
1 792
118 309
July
28 587
24 756
17 767
5 514
9 556
1 302
913
1 472
89 867
August
28 404
24 184
17 169
5 618
9 137
1 418
807
1 420
88 157
September
30 388
25 670
18 890
6 099
9 882
1 734
904
1 411
94 978
October
29 839
25 559
16 990
5 628
9 534
1 488
826
1 372
91 236
November
30 419
26 282
16 814
5 888
8 876
1 650
841
1 462
92 232
December
30 257
26 783
20 853
5 830
9 143
1 645
894
1 404
96 809
2015
January
26 796
22 211
16 570
5 039
8 101
1 364
662
1 373
82 116
February
28 975
24 742
18 212
5 915
8 851
1 409
877
1 443
90 424
March
33 773
28 536
22 499
6 173
9 823
1 560
1 064
1 626
105 054
April
26 264
22 160
17 335
4 843
7 609
1 280
948
1 217
81 656
May
30 996
25 231
19 312
5 429
8 353
1 440
1 144
1 422
93 327
(a) Seasonally adjusted numbers of new motor vehicle sales in Tasmania, Northern Territory and Australian Capital Territory should be used with caution. For more information, see paragraph 7 of the Explanatory Notes.
NOTES
FORTHCOMING ISSUES
ISSUE
Release Date
June 2015
15 July 2015
July 2015
18 August 2015
August 2015
15 September 2015
September 2015
15 October 2015
October 2015
16 November 2015
November 2015
15 December 2015
ABOUT THIS ISSUE
This issue presents details for the Sales of New Motor Vehicles for May 2015.
INQUIRIES
For further information about these and related statistics, contact the National Information and Referral Service on 1300 135 070. The ABS Privacy Policy outlines how the ABS will handle any personal information that you provide to us.
Document Selection
These documents will be presented in a new window.
 Quality Declaration
  Print Page
 Print All