6306.0 - Employee Earnings and Hours, Australia, May 2012  Quality Declaration
ARCHIVED ISSUE Released at 11:30 AM (CANBERRA TIME) 23/01/2013
Page tools:
 Print Page Print Page
 Print All Print All
| ||||||||||||||||||||||||||||||||||||||||||||||||||||||||||||||||||||||||||||||||||||||||||||||||||||||||||||||||||||||||||||||||||||||||||||||||||||||||||||||||||||||||||||||||||||||||||||||||||||||||||||||||||||||||||||||||||||||||||||||||||||||||||||||||||||||||||||||||||||||||
|
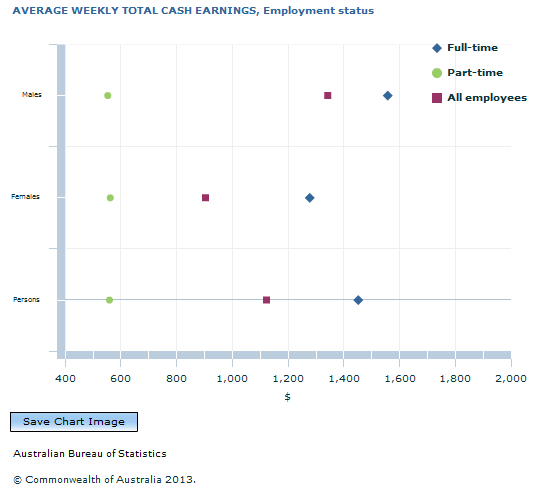
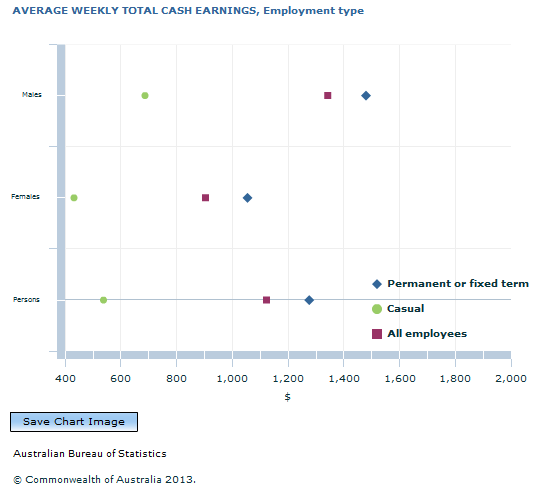
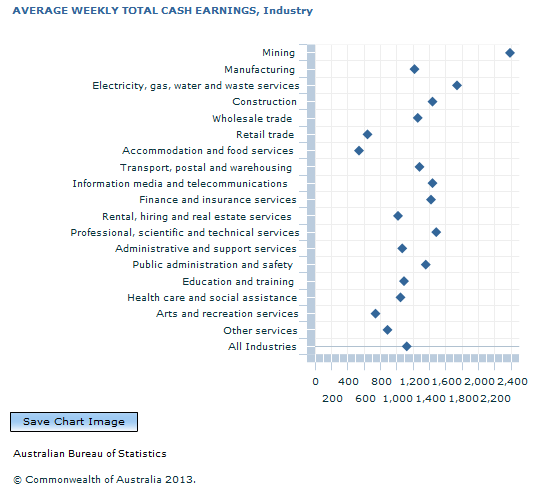
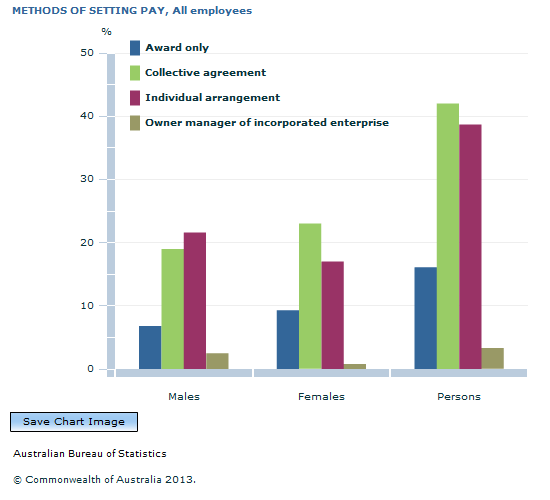
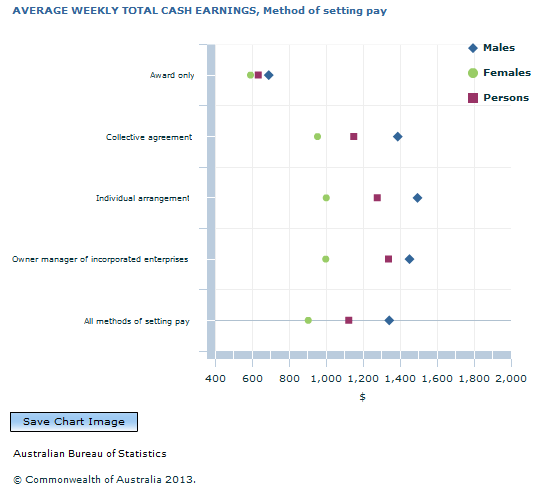
This publication contains statistics on the composition and distribution of earnings and hours paid for, of employees, as well as information on how employees' pay is set - by award only, collective agreement or individual arrangement. The statistics are based on the Survey of Employee Earnings and Hours conducted in respect of May 2012. COMPOSITION BY CATEGORY, ALL EMPLOYEES The diagram below shows the proportion of employees in scope of the May 2012 Survey of Employee Earnings and Hours, by category of employee. HEADLINE RESULTS In May 2012, the average weekly total cash earnings for all employees were $1,122.60 and for all full-time employees were $1,452.00. Median weekly total cash earnings in May 2012 were $963.00 for all employees. One quarter of all employees earned $588.00 or less and one quarter of all employees earned $1,462.00 or more. Median weekly total cash earnings for all full-time employees were $1,250.00. One in ten full-time employees received weekly total cash earnings of $738.00 or less while one in ten full-time employees received weekly total cash earnings of $2,364.00 or more. ALL EMPLOYEES EMPLOYMENT COMPOSITION AND AVERAGE EARNINGS Publication tables with full details of employment composition and average earnings presented in this section, as well as method of setting pay data, are available in Data Cube 1, ALL EMPLOYEES, Average weekly total cash earnings. Fine level occupation data are also available in Data Cube 6, ALL EMPLOYEES, Average weekly total cash earnings, Occupation by Sex and Data Cube 8, ALL EMPLOYEES, Average weekly total cash earnings, Occupation by Method of setting pay. All data cubes, including Standard Error tables, can also be accessed via the Downloads tab. Key results by category In May 2012, 49.9% of all employees were male and 50.1% of all employees were female. Average weekly total cash earnings were $1,122.60 for all employees, $1,342.50 for male employees and $904.00 for female employees. Full-time employees made up 63.1% of all employees and had average weekly total cash earnings of $1,452.00. Part-time employees accounted for 36.9% of all employees and had average weekly total cash earnings of $560.00. Male employees were predominantly full-time (78.5% of male employees) and full-time males had average weekly total cash earnings of $1,558.10. Part-time male employees had average weekly total cash earnings of $553.90. More female employees were employed part-time (52.3%) than full-time (47.7%). Average weekly total cash earnings were $1,278.40 for full-time females and $562.40 for part-time females. The majority of employees (79.2%) were employed on a permanent or fixed term basis and had average weekly total cash earnings of $1,276.10. Average weekly total cash earnings were $1,480.00 for permanent or fixed term males and $1,054.90 for permanent or fixed term females. Casual employees accounted for 20.8% of employees and had average weekly total cash earnings of $538.20. A greater proportion of female employees (24.2%) were casual than were male employees (17.3%). Average weekly total cash earnings were $432.20 for casual females and $687.20 for casual males. Occupation Among major occupation groups, Managers had the highest average weekly total cash earnings ($1,926.40) while Sales workers had the lowest ($606.60). Managers comprised 10.1% of all employees and Sales workers comprised 11.5% of all employees. The highest proportion of employees were Professionals (20.0%) who received average weekly total cash earnings of $1,438.00. Industry Average weekly total cash earnings were highest for employees in the Mining industry ($2,388.20), who represented 1.6% of all employees. The lowest average weekly total cash earnings were for employees in the Accommodation and food services industry ($538.80), who represented 7.2% of employees. The highest proportion of employees were in the Health care and social assistance industry (12.7%) who received average weekly total cash earnings of $1,047.80. States and territories The average weekly total cash earnings of all employees were highest in the Australian Capital Territory ($1,357.00) and lowest in Tasmania ($926.70). The highest proportion of employees was in New South Wales (30.3%) where average weekly total cash earnings were $1,119.70. Sector Average weekly total cash earnings for all employees were higher for employees in the public sector ($1,321.90) than in the private sector ($1,074.20). Private sector employees comprised 80.4% of all employees and public sector employees comprised 19.6% of all employees. Employer Size Of employees other than owner managers of incorporated enterprises, more than half were employed in businesses with 100 or more employees: 29.9% were employed by businesses with 1,000 or more employees; and 27.4% were employed in businesses with between 100 and 999 employees. Almost a quarter (23.3%) were employed in businesses with less than 20 employees. Average weekly total cash earnings were lowest in businesses with under 20 employees ($844.60) and highest in businesses with 1,000 or more employees ($1,256.60). METHODS OF SETTING PAY Information on the methods of setting pay for employees refers to how an employee's pay was set in the survey reference period. Employees classified to 'Award only' had their rate of pay specified by an award and were not paid more than that rate of pay. Employees classified to the 'Collective agreement' category had their pay set by collective agreement, such as an enterprise agreement, or an enterprise award. Those in the 'Individual arrangement' category include employees who had their pay set by an individual contract, registered individual agreement (e.g. Australian Workplace Agreement), common law contract, or an agreement to receive over award payments. Owner managers of incorporated enterprises are presented separately in estimates by methods of setting pay. Publication tables with full details of methods of setting pay presented in this section, as well as employment composition and average earnings data, are available in Data Cube 1, ALL EMPLOYEES, Average weekly total cash earnings. Fine level occupation by method of setting pay tables are also available in Data Cube 8, ALL EMPLOYEES, Average weekly total cash earnings, Occupation by Method of setting pay. All data cubes, including Standard Error tables, can also be accessed via the Downloads tab. Key results by category The most common methods of setting pay for all employees in May 2012 were collective agreement (42.0%) and individual arrangement (38.7%). Award only was the least common method of setting pay (16.1%). The remaining 3.3% of employees were owner managers of incorporated enterprises. For full-time employees, the most common method of setting pay was individual arrangement (46.1%). The most common method of setting pay for part-time employees was collective agreement (46.1%). For all employees, average weekly total cash earnings were highest for owner managers of incorporated enterprises ($1,337.50), followed by employees paid by individual arrangements ($1,277.20), collective agreement ($1,150.80) and award only ($633.80). For full-time employees only, those whose pay was set by collective agreement had the highest average weekly total cash earnings ($1,518.50), followed by individual arrangement ($1,506.50), owner managers of incorporated entities ($1,455.70) and award only ($933.40). For all male employees, the most common method of setting pay was individual arrangement (43.4%), while the most common method of setting pay for all female employees was collective agreement (45.9%). Average weekly total cash earnings for employees who had their pay set by individual arrangement were higher for males than females ($1,494.40 and $1,001.00 respectively). Similarly, earnings for employees who had their pay set by collective agreement were higher for males ($1,388.50) than females ($954.60). The difference in earnings, however, was significantly less for employees whose pay was set by award only ($690.10 for males and $592.70 for females). Collective agreement was the most common method of setting pay for both permanent or fixed term employees (43.4%) and casual employees (36.7%). Occupation More than half of all Community and personal service workers (52.9%) and Professionals (52.3%) were paid by collective agreement. Collective agreement was also the most common method of setting pay for Machinery operators and drivers (47.6%), Labourers (45.3%) and Sales workers (43.8%). Individual arrangement was the most common method of setting pay for Managers (62.1%), Technicians and trades workers (48.8%) and Clerical and administrative workers (48.0%). Although award only was not the most common method of setting pay for any occupation group, the occupations with the largest proportion of employees paid by award only were Labourers (29.0%), Community and personal service workers (28.8%) and Sales workers (25.8%). Managers paid by individual arrangement had the highest average weekly total cash earnings ($2,078.50) whilst Sales workers paid by award only had the lowest average weekly total cash earnings ($422.10). Industry The award only method of setting pay for employees was highest in the Accommodation and food services industry (44.8%). The collective agreement method was highest for the Public administration and safety industry (85.9%). The Professional, scientific and technical services industry had the highest proportion of employees paid by the individual arrangement method (77.3%). Employees in the Mining industry paid by individual arrangement had the highest average weekly total cash earnings ($2,532.50) and employees paid by collective agreement in the Accommodation and food services industry had the lowest average weekly total cash earnings ($398.30). States and territories South Australia had the highest proportion of employees whose pay was set by award only (20.1%). The Australian Capital Territory had the highest proportion of employees whose pay was set by collective agreement (60.4%) and New South Wales had the highest proportion of employees whose pay was set by individual arrangement (41.7%). Of all methods of setting pay, owner managers of incorporated enterprises in Western Australia received the highest average weekly total cash earnings ($2,046.00), followed by employees paid by individual arrangement in the Australian Capital Territory ($1,562.50). Of employees paid by collective agreement, the highest average weekly total cash earnings were received by employees in the Australian Capital Territory ($1,418.00). Employees paid by award only in the Australian Capital Territory had the lowest average weekly total cash earnings ($483.60) of all States/territories. Of those employees paid by award only, the highest average weekly total cash earnings were received in Western Australia ($685.10). Sector The most common method of setting pay in the private sector was individual arrangement (47.2%) followed by collective agreement (30.4%). The average weekly total cash earnings for private sector employees paid by individual arrangement were $1,264.20 and by collective agreement were $1,042.80. Almost nine in ten (89.8%) employees in the public sector were paid by collective agreement. Average weekly total cash earnings for these employees were $1,301.00. Employees paid by award only made up 18.4% of employees in the private sector and 6.7% of employees in the public sector. Employees paid by award only received average weekly total cash earnings of $579.40 in the private sector and $1,249.70 in the public sector. Employer Size Of those employees paid by individual arrangement, almost two in five (39.7%) were employed by businesses with less than 20 employees. A similar proportion (38.2%) of employees paid by award only also worked for businesses with less than 20 employees. Those employees who had their pay set by collective agreement tended to be from larger employers: 56.0% worked in businesses with 1,000 or more employees and 33.0% worked in businesses with 100 to 999 employees. Across every size of employer, those employees paid by individual arrangement had higher average weekly total cash earnings than those paid by collective agreement and award only. Of employees other than owner managers of incorporated enterprises, those working for employers with 1,000 or more employees paid by individual arrangement received the highest average weekly total cash earnings ($1,894.10) and those paid by award only in businesses with under 20 employees received the lowest average weekly total cash earnings ($545.80). DISTRIBUTION OF EARNINGS FOR ALL EMPLOYEES Publication tables with full details of distributions of earnings presented in this section are available in Data Cube 2, ALL EMPLOYEES, Distributions weekly total cash earnings. All data cubes, including Standard Error tables, can also be accessed via the Downloads tab. Weekly total cash earnings, Employment status Median weekly total cash earnings for all full-time adult employees were $1,261.00 and were $1,250.00 for all full-time employees. The lowest paid 10% of all full-time adults received weekly total cash earnings of $769.00 or less while the highest paid 10% received $2,382.00 or more. Median weekly total cash earnings for all part-time employees were $472.00. Although 10% of all part-time employees received weekly total cash earnings of $108.00 or less, 10% received $1,068.00 or more. In May 2012 there were 509,200 full-time employees and 20,500 part-time employees receiving $2,500.00 or more per week.
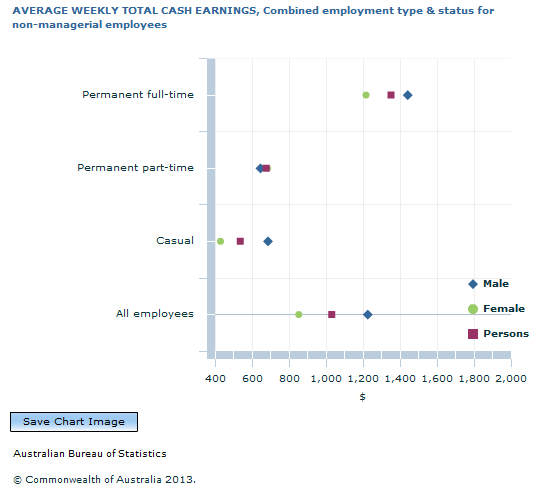
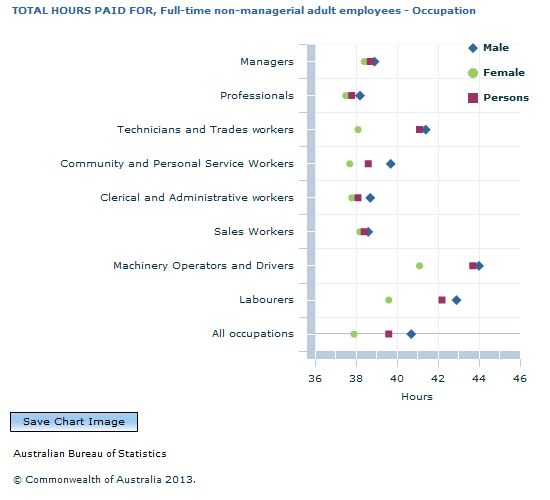
ALL NON-MANAGERIAL EMPLOYEES Data on hours paid for are not collected for those employees classified as managerial employees for the purpose of the Survey of Employee, Earnings and Hours. Results broken down by ordinary time and overtime, as well as hours paid for and hourly rates, are only available for non-managerial employees. See paragraphs 21 and 22 of the Explanatory Notes for further information on the definition of managerial employees. Publication tables with full details of average cash earnings and hours paid for presented in this section, along with data for full-time non-managerial adults, are available in Data Cube 3, NON-MANAGERIAL EMPLOYEES, Averages and Distributions, Cash earnings and hours paid for. All data cubes, including Standard Error tables, can also be accessed via the Downloads tab. EMPLOYMENT COMPOSITION, AVERAGE EARNINGS AND HOURS PAID FOR Method of setting pay and type of employee by Sex Permanent full-time non-managerial employees were paid for, on average, 39.4 hours per week and received average weekly total cash earnings of $1,351.60. Permanent part-time non-managerial employees were paid for, on average 22.9 hours per week and received average weekly total cash earnings of $676.50. Casual non-managerial employees were paid for, on average, 19.3 hours per week at an average hourly total cash earnings rate of $27.80 to receive average weekly total cash earnings of $536.60. Permanent full-time males made up 34.4% of all non-managerial employees. Permanent full-time non-managerial male employees were paid for, on average, 40.4 hours per week at an hourly cash rate of $35.70 to receive $1,442.10 in average weekly total cash earnings. Permanent full-time females made up 23.0% of all non-managerial employees. These employees were paid for, on average, 37.9 hours per week at an hourly cash rate of $32.10 to receive $1,215.90 in average weekly total cash earnings. Permanent part-time females made up 15.7% of all non-managerial employees. A further 13.5% of all non-managerial employees were casual females. Permanent part-time non-managerial females were paid for, on average, 23.2 hours per week at an hourly cash rate of $29.50 to receive average weekly total cash earnings of $684.10. Casual females were paid for, on average 16.4 hours per week at an hourly cash rate $26.20 to receive average weekly total cash earnings of $429.70. Of all non-managerial employees, 9.6% were casual males and only 3.9% were permanent part-time males. Casual non-managerial males were paid for, on average, 23.4 hours per week at an hourly cash rate of $29.40 per hour to receive $686.70 in average weekly total cash earnings. Permanent part-time non-managerial males were paid for, on average, 21.9 hours per week at an hourly cash rate of $29.40 to receive average weekly total cash earnings of $645.70. All non-managerial males, on average, were paid for 35.5 hours per week and received average weekly total cash earnings of $1,226.30. All non-managerial females were paid for, on average, 27.9 hours per week and received average weekly total cash earnings of $852.50. Among non-managerial employees, the most common method of setting pay was collective agreement (44.9%). For permanent full-time non-managerial employees, the most common method of setting pay was individual arrangement (45.6%). The highest average hourly total cash earnings were received by permanent full-time males paid by collective agreement ($38.40), who were also paid for the highest average weekly total hours (40.9 hours) resulting in the highest average weekly total cash earnings ($1,573.60). FULL-TIME NON-MANAGERIAL ADULT EMPLOYEES Analysis of results for full-time non-managerial adult employees provides an opportunity to compare earnings and hours paid for by sex, method of setting pay, occupation, industry and sector without compositional elements such as the proportion of part-time and junior employees. For example, an industry with a large proportion of part-time and junior employees will have lower average earnings for all employees than an industry with a small proportion of part-time and junior employees. Publication tables with full details of average cash earnings and hours paid for plus distributions of total cash earnings presented in this section, along with data for all non-managerial employees, are available in Data Cube 3, NON-MANAGERIAL EMPLOYEES, Averages and Distributions, Cash earnings and hours paid for. A range of finer detail data for Full-time non-managerial adults are available in Data Cube 4, FULL-TIME NON-MANAGERIAL ADULT EMPLOYEES, Average weekly cash earnings and hours paid for—Occupation by Sex by States and Territories, Data Cube 5, FULL-TIME NON-MANAGERIAL ADULT EMPLOYEES, Average weekly cash earnings and hours paid for—Industry by Sex by States and Territories, Data Cube 7, FULL-TIME NON-MANAGERIAL ADULT EMPLOYEES, Average weekly cash earnings and hours paid for—Occupation by Sex and Data Cube 9, FULL-TIME NON-MANAGERIAL ADULT EMPLOYEES, Average weekly cash earnings and hours paid for—Occupation by Method of setting pay. All data cubes, including Standard Error tables can also be accessed via the Downloads tab. TOTAL CASH EARNINGS AND HOURS PAID FOR In May 2012, average weekly total cash earnings were $1,374.40 for full-time non-managerial adult employees ($1,471.70 for male employees and $1,226.40 for female employees). For this category of employee, average weekly total hours paid for were 39.6 hours (40.7 hours for males and 37.9 hours for females). Average hourly total cash earnings for full-time non-managerial adult employees was $34.70. Full-time non-managerial adult employees made up 52.7% of all employees. The most common method of setting pay for these employees was an individual arrangement (45.8%) and for these employees the average weekly total cash earnings was $1,357.30. The next most common method of setting pay was collective agreement (43.9%) and these employees had the highest average weekly total cash earnings of $1,483.10. The least common method of setting pay was award only (10.3%) and for these employees the average weekly total cash earnings was $987.80. Occupation Among the major occupation groups, full-time non-managerial adult Machinery operators and drivers had the highest average weekly total hours paid for (43.7 hours) while Professionals had the lowest average weekly total hours paid for (37.8 hours). Professionals had the highest average hourly total cash earnings ($43.80) among full-time non-managerial adult employees, and Sales workers had the lowest ($27.40). Industry Average weekly total hours paid for were highest in the Mining industry (43.6 hours) and lowest in the Education and training industry (36.8 hours) for full-time non-managerial adult employees. The Mining industry also had the highest average hourly total cash earnings of $52.30. The Accommodation and food services industry had the lowest average hourly total cash earnings of $23.90. Sector For full-time non-managerial adult employees, average weekly total hours paid for were higher in the private sector (40.0 hours) than in the public sector (37.9 hours). In contrast, average hourly total cash earnings were higher in the public sector than the private sector ($39.80 and $33.40 respectively). DISTRIBUTION OF EARNINGS Weekly total cash earnings, Method of setting pay Median weekly total cash earnings for full-time non-managerial adults were $1,212.00. The lowest paid 25% of all full-time non-managerial adults received $933.00 or less in weekly total cash earnings. The next 50% of full-time non-managerial adults received weekly total cash earnings between $933.00 and $1,635.00. One in ten full-time non-managerial adults received weekly total cash earnings of $769.00 or less, while one in ten received weekly total cash earnings of $2,162.00 or more. Median weekly total cash earnings for full-time non-managerial adults were highest for those paid by collective agreement ($1,347.00) followed by individual arrangement ($1,164.00) and award only ($876.00). The middle 50% of full-time non-managerial adults paid by collective agreement received weekly total cash earnings between $1,035.00 and $1,739.00, compared to a range of $923.00 to $1,588.00 for those paid by individual arrangement and $713.00 to $1,135.00 for those paid by award only.
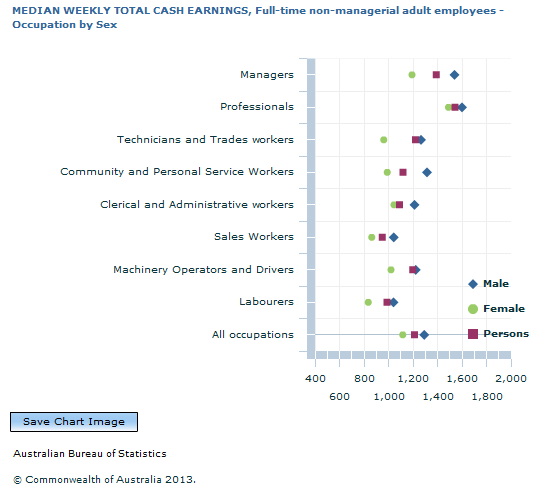
(b) Includes registered and unregistered individual arrangements. (c) Percentiles are based on whole dollars only. Weekly total cash earnings, Occupation by Sex For all full-time non-managerial adults, occupation groups with the highest median weekly total cash earnings were Professionals ($1,543.00) and Managers ($1,390.00). Despite lower median earnings, 30% of Managers received weekly total cash earnings of $1,839.00 or more and 10% received $2,692.00 or more, whereas 30% of Professionals received $1,788.00 or more and 10% received $2,385.00 or more. The occupation groups with the lowest median weekly total cash earnings for full-time non-managerial adults were Sales workers ($949.00) and Labourers ($988.00). The highest paid 10% of Sales workers received $1,601.00 or more, whereas the highest paid 10% of Labourers received $2,025.00 or more. One in ten full-time non-managerial adult Clerical and administrative workers received weekly total cash earnings of $1,680.00 or more, while one in ten full-time non-managerial adult Community and personal service workers received $1,909.00 or more. Median weekly total cash earnings for full-time non-managerial adults were higher for males ($1,292.00) than females ($1,116.00). The lowest paid 10% of full-time non-managerial adult males received weekly total cash earnings of $788.00 or less compared to $741.00 or less for females. The highest paid 10% of full-time non-managerial adult males received weekly total cash earnings of $2,373.00 or more compared to $1,843.00 or more for females. For both male and female full-time non-managerial adults, median weekly total cash earnings were highest for Professionals (males $1,601.00, females $1,489.00) then Managers (males $1,538.00, females $1,193.00) and lowest for Labourers (males $1,042.00, females $834.00) then Sales workers (males $1,044.00, females $863.00). The difference between median weekly total cash earnings for full-time non-managerial adult males and females was smallest for Professionals (males $1,601.00, females $1,489.00) and greatest for Managers (males $1,538.00, females $1,193.00). Weekly total cash earnings, Industry Median weekly total cash earnings for all full-time non-managerial adult employees were highest for those employees in the Mining industry ($2,224.00), which was $650.00 higher than for the next highest industry, Electricity, gas, water and waste services ($1,574.00). One in four full-time non-managerial adult employees in the Mining industry received weekly total cash earnings of $2,719.00 or more. One in four full-time non-managerial adult employees in Electricity, gas, water and waste services received weekly total cash earnings of $2,142.00 or more. By industry, the highest paid 10% of full-time non-managerial adult employees received the highest weekly total cash earnings in Mining ($3,302.00 or more), Construction ($2,856.00 or more) and Electricity, gas, water and waste services ($2,740.00 or more). In contrast, industries with the lowest median weekly total cash earnings for all full-time non-managerial adults were Retail trade ($885.00) and Accommodation and food services ($888.00). One in four full-time non-managerial adults in Retail trade received weekly total cash earnings of $769.00 or less while only one in four received $1,100.00 or more. Similarly, one in four full-time non-managerial adults in Accommodation and food services received weekly total cash earnings of $760.00 or less and only one in four received $1,019.00 or more. One in ten full-time non-managerial adult employees in the Mining industry received weekly total cash earnings of $1,308.00 or less while only one in ten full-time non-managerial adult employees in the Accommodation and food services industry received weekly total cash earnings of $1,189.00 or more. Weekly total cash earnings, Sector Median weekly total cash earnings were greater for full-time non-managerial adult employees in the public sector ($1,417.00) than the private sector ($1,140.00). Earnings for the highest paid 10% of full-time non-managerial adult employees were higher in the private sector ($2,189.00) than the public sector ($2,093.00). In the private sector, the middle 50% of full-time non-managerial adults received weekly total cash earnings between $883.00 and $1,587.00 compared to between $1,154.00 and $1,720.00 in the public sector.
Document Selection These documents will be presented in a new window.
|
|||||||||||||||||||||||||||||||||||||||||||||||||||||||||||||||||||||||||||||||||||||||||||||||||||||||||||||||||||||||||||||||||||||||||||||||||||||||||||||||||||||||||||||||||||||||||||||||||||||||||||||||||||||||||||||||||||||||||||||||||||||||||||||||||||||||||||||||||||||||

