September Key Figures
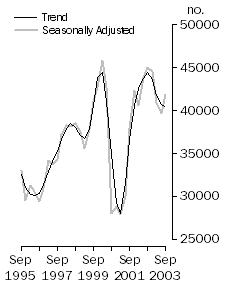
Dwelling units commenced—Total

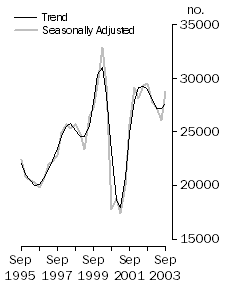
| New houses commenced—Private sector

|
September Key Points
TREND ESTIMATES
- The trend estimate for the total number of dwelling units commenced fell 0.9% in the September quarter 2003, the fourth successive quarterly decline. However, the rate of decline has slowed over the last two quarters.
- New private sector houses rose 2.0% in the latest quarter, following four successive quarterly declines.
SEASONALLY ADJUSTED ESTIMATES
- In seasonally adjusted terms, the total number of dwelling units commenced rose 5.5% to 41,845 in the September quarter. This is still 7.0% fewer than the number a year earlier. The increase in the September quarter follows three successive quarterly declines.
- New private sector house commencements rose 10.4% to 28,785.
- Of the states and territories, Tasmania recorded the largest percentage increase in total dwelling commencements (+14.7%) followed by Queensland (+10.1%), Victoria (+8.8%), New South Wales (+2.4%) and Western Australia (+0.6%), while the Australian Capital Territory and South Australia recorded fall of -38.1% and -0.1% respectively.
Notes
ABOUT THIS ISSUE
This publication provides an early indication of trends in the number of dwelling units commenced. The data are estimates based on a response rate of approximately 90% of a sample of building jobs collected in the Building Activity Survey. More comprehensive and updated results will be released in Building Activity, Australia (cat. no. 8752.0) on 19 January 2004.
CHANGES IN THIS ISSUE
Tables 2 and 3 have replaced the previous table 2. Comments on original estimates have been enhanced and moved from page 1 to page 3 and a separate graph for each state/territory is now included.
SIGNIFICANT REVISIONS THIS ISSUE
This issue includes revisions to recent historical data.
As reported in the October 2003 issue of Building Approvals, Australia (cat. no. 8731.0), significant revisions to the total number of dwellings approved in two municipalities in Queensland were made, necessitating follow-on upward revisions to the number of dwelling units commenced for the December quarter 2000 to June quarter 2003.
A review of our estimation methods has led to downward revisions in the number of dwellings commenced in all states and territories, for the September quarter 2000 to June quarter 2003.
The combined effect of these changes, together with the usual 'previous quarter' revisions for the June quarter 2003, is to revise the total number of dwellings commenced for each state and territory by the following:
 |
 | 2000-01 | 2001-02 | 2002-03 |  |
|  |
| NSW | -188 | -618 | 5 |  |
| Vic. | -67 | -495 | 64 |  |
| Qld | -12 | 347 | 1,114 |  |
| SA | -18 | -48 | -28 |  |
| WA | -30 | -103 | -228 |  |
| Tas. | -4 | -22 | -10 |  |
| NT | - | -7 | -4 |  |
| ACT | -4 | -12 | -17 |  |
| Aust. | -323 | -958 | 896 |  |
|  |
| - nil or rounded to zero (including null cells) |
 |  |  |  |  |
Inquiries
For further information about these and related statistics, contact the National Information and Referral Service on 1300 135 070 or Tony Bammann on Adelaide (08) 8237 7316.
DWELLING UNIT COMMENCEMENTS Original
ORIGINAL ESTIMATES
 |
 |  | Sep qtr 03 | Jun qtr 03 to Sep qtr 03 | Sep qtr 02 to Sep qtr 03 |  |
 |  | no. | % change | % change |  |
|  |
| Dwelling units commenced |  |  |  |  |
 | New private sector houses | 30,744 | 19.0 | -1.7 |  |
 | Other private sector dwellings | 12,793 | 2.8 | -17.8 |  |
 | Public sector dwellings | 1,255 | 26.3 | 10.8 |  |
 | Total dwelling units | 44,792 | 14.0 | -6.6 |  |
|  |
- The total number of dwelling units commenced rose 14.0% in the September quarter to 44,792.
- New private sector house commencements rose 19.0% to 30,744. Victoria recorded the largest percentage increase (+34.6%) followed by Queensland (+23.4%), Tasmania (+22.1%) and Western Australia (+15.9%), while only the Australian Capital Territory recorded a decrease.
- Other private sector dwellings rose 2.8% to 12,793, to be 17.8% fewer than a year earlier. The increase was due to rises in New South Wales (+18.6%) and Queensland (+9.8%) with the largest percentage falls being in the Australian Capital Territory (-81.8%), Tasmania (-55.3%), the Northern Territory (-47.8%) and Victoria (-17.8%).
- The total number of public sector dwellings commenced rose 26.3% to 1,255, with increases in both houses and other dwellings.
DWELLING UNIT COMMENCEMENTS States and territories
NEW SOUTH WALES
Following six quarters of growth starting with the June quarter 2001, the trend estimate of commencements has fallen for the last four quarters.
VICTORIA
Following six quarters of growth starting with the March quarter 2001, the trend estimate of commencements fell for the next four quarters but flattened for the latest quarter.
QUEENSLAND
After a slight lull in early 2003 the trend estimate of commencements has returned to the growth which started with the June quarter 2001.
SOUTH AUSTRALIA
Following six quarters of growth starting with the June quarter 2001, the trend estimate of commencements has fallen for the last four quarters.
WESTERN AUSTRALIA
The trend estimate of commencements has risen steadily for the last 11 quarters, commencing with the March quarter 2001.
TASMANIA
Starting with the June quarter 2001, the trend estimate of commencements has shown strong growth other than a brief lull in the last half of 2002.
NORTHERN TERRITORY
The trend estimate of commencements continues to fall, although at a slower rate than in the late 1990s.
AUSTRALIAN CAPITAL TERRITORY
Following seven quarters of growth starting with the June quarter 2001, the trend estimate of commencements has fallen for the last three quarters.
Abbreviations
| ABS | Australian Bureau of Statistics |
| qtr | quarter |
 Print Page
 Print All