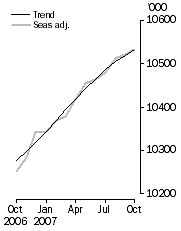
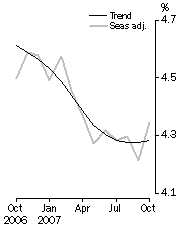
11/8/2007 A second version of this release was issued at 1:20pm on 8 November 2007, one hour and 50 minutes after first issued. This second version of the release corrects the increments on the y-axis of the unemployment rate graph below and on the front page of the publication. No estimates have changed between the first and second release of this issue.
OCTOBER KEY FIGURES
 |  | Sep 2007 | Oct 2007 | Sep 07 to Oct 07 | Oct 06 to Oct 07 |
|
| Trend |  |  |  |  |  |  |
 | Employed persons ('000) | 10 520.6 | 10 532.1 | 11.5 |  | 2.5 | % |
 | Unemployed persons ('000) | 470.0 | 471.1 | 1.2 |  | -5.2 | % |
 | Unemployment rate (%) | 4.3 | 4.3 | 0.0 | pts | -0.3 | pts |
 | Participation rate (%) | 65.0 | 65.0 | 0.0 | pts | 0.3 | pts |
| Seasonally Adjusted |  |  |  |  |  |  |
 | Employed persons ('000) | 10 520.9 | 10 533.8 | 12.9 |  | 2.7 | % |
 | Unemployed persons ('000) | 462.8 | 478.5 | 15.7 |  | -0.9 | % |
 | Unemployment rate (%) | 4.2 | 4.3 | 0.1 | pts | -0.2 | pts |
 | Participation rate (%) | 65.0 | 65.0 | 0.1 | pts | 0.5 | pts |
|
Employed Persons

| Unemployment rate

|
OCTOBER KEY POINTS
TREND ESTIMATES (MONTHLY CHANGE)
- EMPLOYMENT increased to 10,532,100
- UNEMPLOYMENT increased to 471,100
- UNEMPLOYMENT RATE remained at 4.3%
- PARTICIPATION RATE remained at 65.0%
SEASONALLY ADJUSTED ESTIMATES (MONTHLY CHANGE)
EMPLOYMENT
- increased by 12,900 to 10,533,800. Full-time employment increased by 70,600 to 7,587,700 and part-time employment decreased by 57,700 to 2,946,100.
UNEMPLOYMENT
- increased by 15,700 to 478,500. The number of persons looking for full-time work increased by 7,400 to 316,300 and the number of persons looking for part-time work increased by 8,300 to 162,200.
UNEMPLOYMENT RATE
- increased by 0.1 percentage point to 4.3%. The male unemployment rate increased by 0.2 percentage points to 4.0%, and the female unemployment rate increased by 0.1% percentage point to 4.8%.
PARTICIPATION RATE
- remained steady at 65.0%.
NOTES
FORTHCOMING ISSUES
| ISSUE | Release Date |
| November 2007 | 13 December 2007 |
| December 2007 | 17 January 2008 |
| January 2008 | 14 February 2008 |
| February 2008 | 13 March 2008 |
| March 2008 | 10 April 2008 |
| April 2008 | 8 May 2008 |
FORTHCOMING CHANGES
Following each Census of Population and Housing, the ABS selects a new sample for the Labour Force Survey. This is done to ensure that the sample continues to accurately represent the distribution of the Australian population. A new sample has recently been selected based on the 2006 Census.
In order to reduce the potential impact of the change in sample on labour force statistics, the new sample will be introduced progressively, taking advantage of the existing rotation scheme. Using this scheme, the private dwelling sample in larger urban centres and less remote areas, representing approximately four-fifths of the total sample, will be phased in over the period November 2007 to June 2008. Within these areas, one-eighth of the new sample will be introduced each month under existing sample rotation arrangements. The rest of the sample (in remote, less populated areas and for non-private dwellings) will be introduced in two stages, March and April 2008. Detailed information about the new sample will be provided in Information Paper: Labour Force Survey Sample Design (cat. no. 6269.0), which will be released on 27 November 2007.
SAMPLING ERRORS
The estimates in this publication are based on a sample survey. Because the entire population is not enumerated, the published estimates and the movements derived from them are subject to sampling variability. Standard errors give a measure of this variability and appear on pages 28 and 29.
The 95% confidence intervals below provide another way of looking at the variability inherent in estimates from sample surveys. A 95% confidence interval has a 95% chance of including the true value of the estimate.
Movements in seasonally adjusted series between September and October 2007 |
|  |
 | Monthly change | 95% Confidence interval |  |
 |  |  |  |  |  |
|  |
| Total Employment | 12 900 | -34 100 | to | 59 900 |  |
| Total Unemployment | 15 700 | -8 500 | to | 39 900 |  |
| Unemployment rate | 0.1 pt | -0.1 pt | to | 0.3 pts |  |
| Participation rate | 0.1 pt | -0.1 pt | to | 0.3 pts |  |
|  |
INQUIRIES
For further information about these and related statistics, contact the National Information and Referral Service on 1300 135 070 or Rebecca Cash on Canberra (02) 6252 6525.
 Print Page
 Print All