9314.0 - Sales of New Motor Vehicles, Australia, June 2017 Quality Declaration 
ARCHIVED ISSUE Released at 11:30 AM (CANBERRA TIME) 18/07/2017   
   Page tools: Print Print Page Print all pages in this productPrint All


JUNE KEY FIGURES

NSW
Vic.
Qld
SA
WA
Tas.(a)
NT(a)
ACT(a)
Aust.

Vehicle sales
Trend (no.)
33 643
28 794
20 168
6 159
7 944
1 593
963
1 582
100 845
Seasonally Adjusted (no.)
33 768
29 425
20 742
6 227
7 836
1 609
1 012
1 656
102 275
Change from previous month
Trend (%)
0.5
1.4
1.8
1.1
-
0.5
2.8
0.8
1.0
Seasonally Adjusted (%)
-0.1
2.6
3.1
1.0
-4.0
-0.4
7.0
6.0
1.2
Change from previous year
Trend (%)
2.0
6.4
4.3
4.0
-5.2
-0.9
5.2
2.3
3.2
Seasonally Adjusted (%)
2.7
7.4
3.8
5.8
-6.8
3.7
8.7
-3.2
3.6

- nil or rounded to zero (including null cells)
(a) Seasonally adjusted numbers of new motor vehicle sales in Tasmania, Northern Territory and Australian Capital Territory should be used with caution. For more information, see paragraph 7 of the Explanatory Notes.


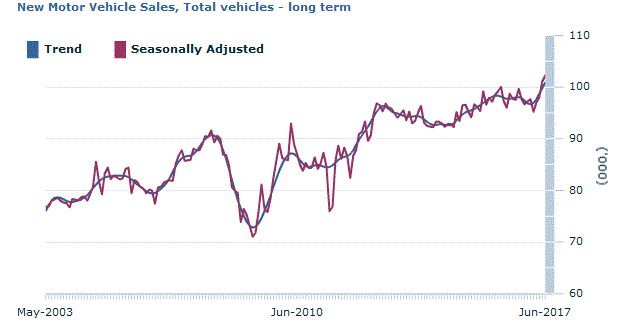
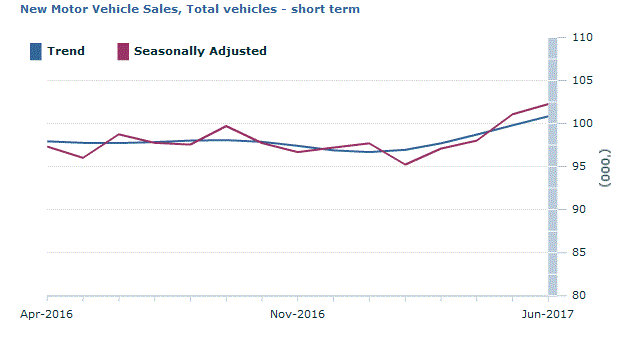
JUNE TREND ESTIMATES KEY POINTS
  • The June 2017 trend estimate (100,845) increased by 1.0% when compared with May 2017.
  • When comparing national trend estimates for June 2017 with May 2017, sales for Passenger vehicles, Sports utility vehicles and Other vehicles increased by 0.5%, 1.4% and 1.3% respectively.
  • The largest upward movement across all states and territories, on a trend basis, was in the Northern Territory (2.8%), continuing an upward trend that began in January 2017.
  • There was no downward movement across any of the states and territories, on a trend basis.


SUMMARY COMMENTARY

Graph Image for New Motor Vehicle Sales, Total vehicles - long term
Graph Image for New Motor Vehicle Sales, Total vehicles - short term

New motor vehicle sales by type of vehicle by month

Count Passenger vehicles
Count Sports utility vehicles
Count Other vehicles
Count Total vehicles
Change Passenger vehicles
Change Sports utility vehicles
Change Other vehicles
Change Total vehicles
no.
no.
no.
no.
%
%
%
%

Trend

2016
April
40 865
36 127
20 959
97 951
-0.2
-0.3
-0.3
-0.2
May
40 752
36 152
20 856
97 761
-0.3
0.1
-0.5
-0.2
June
40 567
36 427
20 751
97 745
-0.5
0.8
-0.5
-
July
40 296
36 844
20 711
97 851
-0.7
1.1
-0.2
0.1
August
40 031
37 245
20 762
98 038
-0.7
1.1
0.2
0.2
September
39 858
37 441
20 800
98 099
-0.4
0.5
0.2
0.1
October
39 686
37 417
20 787
97 890
-0.4
-0.1
-0.1
-0.2
November
39 419
37 228
20 764
97 411
-0.7
-0.5
-0.1
-0.5
December
39 067
36 988
20 837
96 892
-0.9
-0.6
0.4
-0.5
2017
January
38 726
36 904
21 060
96 690
-0.9
-0.2
1.1
-0.2
February
38 441
37 111
21 408
96 960
-0.7
0.6
1.7
0.3
March
38 332
37 565
21 811
97 708
-0.3
1.2
1.9
0.8
April
38 392
38 113
22 206
98 712
0.2
1.5
1.8
1.0
May
38 571
38 689
22 549
99 810
0.5
1.5
1.5
1.1
June
38 755
39 247
22 843
100 845
0.5
1.4
1.3
1.0

Seasonally Adjusted

2016
April
41 088
35 752
20 483
97 323
-2.3
-1.7
-5.5
-2.7
May
39 529
35 964
20 523
96 016
-3.8
0.6
0.2
-1.3
June
42 313
35 955
20 483
98 752
7.0
-
-0.2
2.8
July
40 048
36 605
21 107
97 760
-5.4
1.8
3.0
-1.0
August
39 460
37 330
20 763
97 553
-1.5
2.0
-1.6
-0.2
September
40 105
38 504
21 096
99 705
1.6
3.1
1.6
2.2
October
39 373
38 151
20 203
97 727
-1.8
-0.9
-4.2
-2.0
November
38 906
36 684
21 091
96 681
-1.2
-3.8
4.4
-1.1
December
40 453
35 483
21 262
97 198
4.0
-3.3
0.8
0.5
2017
January
39 234
37 940
20 527
97 701
-3.0
6.9
-3.5
0.5
February
37 639
36 816
20 775
95 230
-4.1
-3.0
1.2
-2.5
March
37 107
37 909
22 090
97 107
-1.4
3.0
6.3
2.0
April
38 148
37 116
22 771
98 035
2.8
-2.1
3.1
1.0
May
39 762
38 693
22 619
101 074
4.2
4.2
-0.7
3.1
June
39 199
40 395
22 681
102 275
-1.4
4.4
0.3
1.2

Original

2016
April
36 671
31 783
19 117
87 571
-16.0
-17.3
-14.7
-16.2
May
38 222
36 230
22 220
96 672
4.2
14.0
16.2
10.4
June
53 832
46 011
28 726
128 569
40.8
27.0
29.3
33.0
July
38 033
33 817
19 481
91 331
-29.3
-26.5
-32.2
-29.0
August
38 945
36 396
19 568
94 909
2.4
7.6
0.4
3.9
September
42 076
39 497
21 123
102 696
8.0
8.5
7.9
8.2
October
37 817
36 442
19 098
93 357
-10.1
-7.7
-9.6
-9.1
November
39 852
37 536
21 549
98 937
5.4
3.0
12.8
6.0
December
42 385
34 936
21 442
98 763
6.4
-6.9
-0.5
-0.2
2017
January
34 920
34 127
15 863
84 910
-17.6
-2.3
-26.0
-14.0
February
34 740
35 497
18 788
89 025
-0.5
4.0
18.4
4.8
March
38 972
41 484
24 954
105 410
12.2
16.9
32.8
18.4
April
32 147
31 368
19 620
83 135
-17.5
-24.4
-21.4
-21.1
May
38 842
39 629
24 430
102 901
20.8
26.3
24.5
23.8
June
50 646
51 393
32 132
134 171
30.4
29.7
31.5
30.4

- nil or rounded to zero (including null cells)

New motor vehicle sales by state/territory of registration

NSW
Vic.
Qld
SA
WA
Tas.(a)
NT(a)
ACT(a)
Aust.

Trend

2016
April
33 210
26 798
19 459
5 961
8 479
1 558
920
1 566
97 951
May
33 098
26 858
19 396
5 936
8 413
1 572
921
1 565
97 761
June
32 987
27 051
19 333
5 923
8 380
1 608
915
1 547
97 745
July
32 942
27 275
19 263
5 931
8 352
1 657
904
1 526
97 851
August
32 998
27 491
19 181
5 954
8 303
1 703
890
1 518
98 038
September
33 081
27 642
19 057
5 968
8 214
1 734
877
1 526
98 099
October
33 085
27 669
18 930
5 962
8 097
1 738
864
1 545
97 890
November
32 981
27 575
18 818
5 936
7 973
1 712
853
1 562
97 411
December
32 852
27 420
18 751
5 905
7 885
1 664
847
1 569
96 892
2017
January
32 798
27 340
18 772
5 888
7 861
1 616
850
1 564
96 690
February
32 861
27 415
18 896
5 908
7 874
1 587
864
1 556
96 960
March
33 037
27 658
19 137
5 959
7 899
1 579
885
1 553
97 708
April
33 258
28 001
19 459
6 023
7 922
1 580
910
1 558
98 712
May
33 492
28 386
19 810
6 090
7 941
1 585
937
1 569
99 810
June
33 643
28 794
20 168
6 159
7 944
1 593
963
1 582
100 845

Seasonally Adjusted

2016
April
33 089
26 856
18 958
5 839
8 480
1 599
896
1 607
97 323
May
32 449
26 249
19 202
6 028
8 007
1 582
920
1 580
96 016
June
32 886
27 389
19 991
5 885
8 407
1 551
931
1 711
98 752
July
32 938
27 027
19 338
5 794
8 688
1 577
873
1 524
97 760
August
32 774
27 580
18 871
6 015
8 242
1 709
908
1 455
97 553
September
33 749
27 941
19 112
6 204
8 348
1 869
923
1 561
99 705
October
33 297
27 884
18 727
5 718
8 013
1 766
814
1 509
97 727
November
32 068
27 673
19 102
5 997
7 752
1 682
851
1 555
96 681
December
33 657
26 352
18 943
6 019
8 052
1 653
846
1 675
97 198
2017
January
32 749
28 811
18 432
5 893
7 818
1 589
862
1 547
97 701
February
32 326
26 548
18 879
5 679
7 826
1 562
888
1 522
95 230
March
32 813
27 296
19 134
6 008
7 913
1 581
827
1 536
97 107
April
33 441
27 799
18 942
6 011
7 842
1 561
906
1 533
98 035
May
33 816
28 682
20 121
6 166
8 165
1 616
946
1 563
101 074
June
33 768
29 425
20 742
6 227
7 836
1 609
1 012
1 656
102 275

Original

2016
April
29 391
23 963
17 753
5 174
7 601
1 313
969
1 407
87 571
May
32 867
26 125
19 565
5 949
7 935
1 503
1 180
1 548
96 672
June
43 449
34 262
27 270
7 613
10 749
1 853
1 240
2 133
128 569
July
30 219
25 517
18 445
5 210
8 234
1 389
831
1 486
91 331
August
31 788
27 096
18 062
5 785
8 144
1 743
881
1 410
94 909
September
34 424
28 766
19 702
6 551
8 668
2 074
880
1 631
102 696
October
31 850
27 546
16 870
5 450
7 580
1 937
713
1 411
93 357
November
32 955
28 991
18 733
6 259
7 657
1 903
808
1 631
98 937
December
33 632
27 065
19 252
6 464
8 026
1 918
734
1 672
98 763
2017
January
29 068
24 535
15 709
5 134
7 037
1 337
652
1 438
84 910
February
30 221
24 917
17 474
5 354
7 526
1 334
760
1 439
89 025
March
35 677
29 252
21 217
6 387
8 712
1 536
946
1 683
105 410
April
28 565
23 292
16 312
4 951
6 634
1 214
910
1 257
83 135
May
34 545
29 077
20 674
6 133
8 154
1 540
1 276
1 502
102 901
June
44 341
37 255
28 768
8 213
10 161
1 953
1 333
2 147
134 171

(a) Seasonally adjusted numbers of new motor vehicle sales in Tasmania, Northern Territory and Australian Capital Territory should be used with caution. For more information, see paragraph 7 of the Explanatory Notes.