JANUARY KEY FIGURES
 | Trend estimates
| Seasonally adjusted estimates
| |
| Jan 2005 | Dec 2004 to Jan 2005 | Jan 2005 | Dec 2004 to Jan 2005 | |
| |
| Value of dwelling commitments(a) | $m | % change | $m | % change | |
| Total dwellings | 16,975 | 1.1 | 16,992 | -1.0 | |
| Owner occupied housing | 11,144 | 1.1 | 11,150 | -0.7 | |
| Investment housing - fixed loans(b) | 5,830 | 1.1 | 5,842 | -1.5 | |
| Number of dwelling commitments(a) | no. | % change | no. | % change | |
| Owner occupied housing | 53,007 | 0.8 | 53,238 | 0.5 | |
| Construction of dwellings | 4,324 | 0.1 | 4,385 | 2.4 | |
| Purchase of new dwellings | 1,976 | 0.3 | 1,936 | -4.3 | |
| Purchase of established dwellings | 46,707 | 0.9 | 46,917 | 0.5 | |
| |
| (a) Includes refinancing. |
| (b) Excludes revolving credit. |
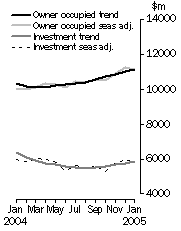
Housing finance, Value of dwellings
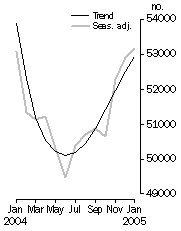
| Owner occupied housing finance, Number of dwellings
|
JANUARY KEY POINTS
TREND ESTIMATES
- Total value of dwelling finance commitments (excluding alterations and additions) increased by 1.1% in January 2005, the sixth consecutive monthly increase. Owner occupied housing increased by 1.1%, the tenth consecutive monthly increase. Investment housing rose by 1.1%, the fifth consecutive monthly increase following eleven consecutive months of decreasing commitments.
- The number of housing finance commitments for owner occupation increased by 0.8% in January 2005, while the number excluding refinancing rose by 1.1%.
SEASONALLY ADJUSTED ESTIMATES
- Total value of dwelling finance commitments (excluding alterations and additions) fell by 1.0% in January 2005, following two consecutive monthly increases. This fall was due to decreases in both investment housing commitments (down 1.5%) and owner occupied housing commitments (down 0.7%).
- The number of housing finance commitments for owner occupied housing increased by 0.5% in January 2005, the sixth monthly increase in the past seven months. The number excluding refinancing increased by 1.1%.
ORIGINAL ESTIMATES
- First home buyer commitments as a percentage of total commitments remained steady at 16.4% in January 2005.
NOTES
REVISIONS IN THIS ISSUE
As announced in the last issue, revisions to a number of series have been introduced in this issue. This follows consultation with a number of data providers. The key series affected are outlined below.
The number and value of owner occupied housing commitments for the construction of dwellings has been revised downward in all states and territories back to November 1995, mainly due to the incorrect inclusion of finance commitments for the purchase of individual residential blocks of land. Where a subsequent commitment is required to finance the construction of an owner-occupied dwelling, these land loans are included as a Personal Finance commitment in Table 4 of 5671.0 Lending Finance, Australia.
Some providers have corrected under-reporting of housing finance commitments. This has resulted in upward revisions to all of the purpose components of both owner-occupied and investment housing, and significant impacts on Bank finance commitments for Queensland.
The value of commitments not advanced at end of month (Table 8) has been significantly revised back to February 1999, due to rebasing by a lender which had underreported advances for some time. The extent of the rebasing is reflected in upward revisions to advances back to February 1999. The ABS will review the importance of this item to users, given the difficulties in reporting this item accurately by data providers.
INQUIRIES
For further information about these and related statistics, contact the National Information and Referral Service on 1300 135 070 or Darren Page on (02) 6252 6731.
SUMMARY COMMENTARY
SUMMARY OF FINDINGS
DWELLINGS FINANCED
Value of Dwellings Financed
The total value of dwelling commitments excluding alterations and additions (seasonally adjusted) decreased by 1.0% in January 2005. The total housing finance trend increased by 1.1%, the sixth consecutive month of increases.
The total value of owner occupied commitments (seasonally adjusted) decreased by 0.7% (down $74m) in January 2005, following increases in the past two months. The small increase in the number of commitments compared to the decline in value of commitments reflects a fall in the average loan size in January. Decreases in the purchase of established dwellings excluding refinancing (down $89m, -1.3%), refinancing of established dwellings (down $3m, -0.1%) and purchase of new dwellings (down $1m, -0.2%) were offset partially by an increase in construction of dwellings (up $19m, 2.0%).
The seasonally adjusted series for value of investment housing commitments (including finance for construction and finance for rent or resale) decreased by 1.5% (down $90m) in January 2005, following rises in the past two months. The decrease this month was due to decreases in purchase of dwellings for rent or resale by individuals (down $37m, -0.8%), purchase of dwellings for rent or resale by others (down $31m, -6.2%) and finance for the construction of dwellings for rent or resale (down $22m, -4.0%). The trend series in total value of investment commitments rose by 1.1%.
INVESTMENT HOUSING - TOTAL
Number of Owner Occupied Dwellings Financed
The number of owner occupied dwelling commitments (seasonally adjusted) increased by 0.5% (up 256) in January 2005, the sixth increase in the past seven months. Increases in the purchase of established dwellings excluding refinancing (up 410, 1.3%) and construction of dwellings (up 104, 2.4%) more than offset decreases in refinancing of established dwellings (down 171, -1.1%) and purchase of new dwellings (down 87, -4.3%).
The total owner occupied housing finance trend rose by 0.8% in January 2005, the seventh consecutive monthly increase.
Increases were recorded in seasonally adjusted terms in Queensland (up 308, 2.7%), Victoria (up 307, 2.6%), Tasmania (up 150, 14.4%) and Australian Capital Territory (up 43, 7.5%). These increases were partially offset by falls in New South Wales (down 556, -3.5%), South Australia (down 59, -1.3%), Western Australia (down 25, -0.4%) and Northern Territory (down 19, -3.3%). The trend increased in all states and territories except Western Australia and Northern Territory.
In original terms, first home buyer commitments as a percentage of total owner occupied housing commitments remained steady at 16.4% in January 2005. The average loan size for owner occupied housing commitments fell after four consecutive monthly increases, decreasing by $3,900 to $208,300 in January 2005.
Number of Owner Occupied Dwellings Financed Excluding Refinancing
The number of owner occupied dwellings financed excluding refinancing (seasonally adjusted) increased by 1.1% in January 2005, after a similar increase in December. The trend increased by 1.1% in January 2005, the eighth consecutive monthly increase.
PURPOSE OF FINANCE (OWNER OCCUPATION)
Construction of dwellings
The seasonally adjusted number of construction commitments for owner occupation rose by 2.4% in January 2005, following a decrease of 0.7% in December. The trend series increased slightly by 0.1% in January.
Purchase of new dwellings
The number of finance commitments for the purchase of new dwellings for owner occupation (seasonally adjusted) fell by 4.3% in January 2005, following an increase of 4.1% in December. The trend series rose 0.3% in January 2005.
Purchase of established dwellings
The seasonally adjusted established dwelling for owner occupation series increased by 0.5% in January 2005, after a 1.3% increase in December. The trend rose by 0.9% in January 2005, the seventh consecutive monthly increase.
Refinancing
The number of refinancing commitments for owner occupied housing (seasonally adjusted) fell by 1.1% in January 2005, after a rise of 1.6% in December. The trend series remained virtually unchanged in January, following five consecutive months of slight increases.
TYPE OF LENDER (OWNER OCCUPATION)
Banks
The number of owner occupied dwellings financed by banks (seasonally adjusted) increased by 1.1% in January 2005, after an rise of 1.1% in December. The trend series increased by 1.0% in January, the seventh consecutive monthly increase.
Non-banks
Non-bank commitments for owner occupied housing (seasonally adjusted) decreased by 1.6% in January 2005, following increases in six of the past seven months. Wholesale lenders were down 2.7% while permanent building societies were up 2.3%. The non-bank trend series increased by 0.4% in January 2005, the seventh consecutive monthly increase.
HOUSING LOAN OUTSTANDINGS
At the end of January 2005, housing loans outstanding of authorised deposit-taking institutions was $503,343m, up $5,934m (1.2%) from December's closing balance. Owner occupied housing loans increased by $4,158m (1.3%) to close at $335,386m, while investment housing loans outstanding increased by $1,776m (1.1%) to reach a closing balance of $167,957m.
Bank loans increased by $5,720m (1.2%) during January to a closing stock of $473,819m. Owner occupied housing loans of banks increased by $3,973m (1.3%) to $311,734m, while investment housing loans increased $1,747m (1.1%) to $162,085m.
 Print Page
 Print All