|
|
PUBLICATION
This publication presents monthly information on sales of new motor vehicles in each state/territory in original, seasonally adjusted and trend estimated terms. The original data are sourced from the Federal Chamber of Automotive Industries. Sales data are available for passenger vehicles, sports utility vehicles (SUVs), other vehicles and total vehicles at the state/territory and national levels.
APRIL 2005 KEY POINTS
Trend
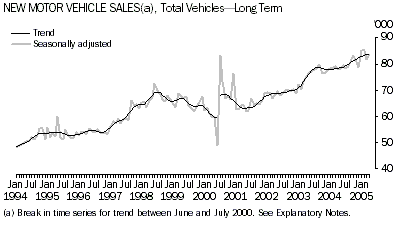
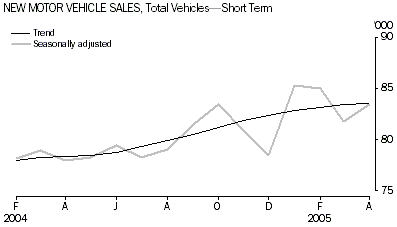
The April 2005 trend estimate (83,620) for sales of new motor vehicles increased 0.2% on the March 2005 estimate. It is the sixteenth consecutive monthly increase in the trend estimate. Compared with April 2004 (78,350), the trend estimate has increased 6.7%.
April 2005 sales of new passenger vehicles and other new motor vehicles each recorded a trend increase of 0.2% over the previous month, while sales of sports utility vehicles increased 0.1%. Of all vehicle types, sales of sports utility vehicles has shown the largest increase compared with April 2004 (14.1%). Sales of passenger vehicles recorded a 6.0% increase, while sales of other new vehicles increased by 2.4% over this period.
The Northern Territory recorded the largest increase (1.6%) in April 2005 compared with March 2005, while Tasmania recorded the largest decrease (-1.1%). Tasmania (11.8%) and Western Australia (11.7%) recorded the largest increases compared with April 2004.
Seasonally adjusted
The seasonally adjusted estimate for sales of new motor vehicles for April 2005 recorded an increase (2.0%) over March 2005. Sales of passenger vehicles and other new vehicles increased 2.1% and 8.4% respectively, while sales of sports utility vehicles decreased 4.2% over the same period.
Most states recorded increases in seasonally adjusted estimates for sales of new motor vehicles in April 2005 compared with March 2005. Western Australia recorded the highest increase (7.2%) while decreases were recorded in the Australian Capital Territory (-13.9%), Tasmania (-8.2%) and the Northern Territory (-0.1%).
Sales Of New Motor Vehicles, April 2005
 | NSW | Vic. | Qld | SA | WA | Tas.(a) | NT(a) | ACT(a) | Aust. |
Vehicle Sales
|
 |  |  |  |  |  |  |  |  |  |
| Seasonally Adjusted | 26,319 | 21,278 | 18,562 | 5,467 | 8,287 | 1,621 | 782 | 1,174 | 83,490 |
| Trend | 26,686 | 21,283 | 18,264 | 5,492 | 8,106 | 1,698 | 801 | 1,290 | 83,620 |
Percentage Change From Previous Month
|
 |  |  |  |  |  |  |  |  |  |
| Seasonally Adjusted | 0.1 | 1.2 | 6.2 | 1.4 | 7.2 | -8.2 | -0.1 | -13.9 | 2.0 |
| Trend | 0.2 | -0.8 | 1.1 | 0.4 | 0.8 | -1.1 | 1.6 | -0.3 | 0.2 |
Percentage Change From Previous Year
|
 |  |  |  |  |  |  |  |  |  |
| Seasonally Adjusted | 3.9 | 3.3 | 14.6 | 5.4 | 16.5 | 7.4 | 2.6 | -4.9 | 7.1 |
| Trend | 4.9 | 4.6 | 9.8 | 6.1 | 11.7 | 11.8 | 5.8 | 7.2 | 6.7 |
|
(a) Seasonally adjusted numbers of new motor vehicle sales in Tasmania, Northern Territory and Australian Capital Territory should be used with caution. For further information, see paragraph 7 of the Explanatory Notes.
NOTES
TREND REVISIONS
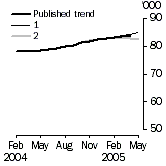
Trend estimates are likely to be revised when new seasonally adjusted estimates become available. For further information, see Explanatory Notes, paragraphs 11 and 12.
The graph below presents the effect of two possible scenarios on the previous trend estimates.
| 1 | The May 2005 seasonally adjusted estimate of total vehicle sales is higher than the April 2005 seasonally adjusted estimate by 3.8%. |
| 2 | The May 2005 seasonally adjusted estimate of total vehicle sales is lower than the April 2005 seasonally adjusted estimate by 3.8%. |
The percentage change of 3.8% was chosen because the average absolute percentage change over the last 10 years has been 3.8%.
 SUMMARY - TREND AND SEASONALLY ADJUSTED ESTIMATES

 Table 1: New Motor Vehicle Sales
|  |  |
 |  | Passenger vehicles (No.) | Sports utility vehicles (No.) | Other vehicles (No.) | Total vehicles (No.) | Change passenger vehicles (%) | Change sports utility vehicles (%) | Change other vehicles (%) | Change total vehicles (%) |  |  |
|  |  |
Original |  |  |
|  |  |
| 2004 | February | 47,876 | 12,865 | 15,136 | 75,877 | 17.6 | 4.7 | 28.4 | 17.1 |  |  |
 | March | 53,728 | 15,005 | 17,313 | 86,046 | 12.2 | 16.6 | 14.4 | 13.4 |  |  |
 | April | 44,079 | 12,351 | 14,875 | 71,305 | -18.0 | -17.7 | -14.1 | -17.1 |  |  |
 | May | 46,168 | 15,052 | 17,059 | 78,279 | 4.7 | 21.9 | 14.7 | 9.8 |  |  |
 | June | 58,284 | 17,981 | 20,947 | 97,212 | 26.2 | 19.5 | 22.8 | 24.2 |  |  |
 | July | 46,724 | 14,442 | 15,869 | 77,035 | -19.8 | -19.7 | -24.2 | -20.8 |  |  |
 | August | 48,649 | 14,910 | 15,685 | 79,244 | 4.1 | 3.2 | -1.2 | 2.9 |  |  |
 | September | 49,911 | 14,715 | 15,826 | 80,452 | 2.6 | -1.3 | 0.9 | 1.5 |  |  |
 | October | 52,290 | 13,907 | 15,470 | 81,667 | 4.8 | -5.5 | -2.2 | 1.5 |  |  |
 | November | 52,888 | 15,257 | 16,190 | 84,335 | 1.1 | 9.7 | 4.7 | 3.3 |  |  |
 | December | 48,673 | 14,311 | 15,996 | 78,980 | -8.0 | -6.2 | -1.2 | -6.3 |  |  |
 |  |  |  |  |  |  |  |  |  |  |  |
| 2005 | January | 43,075 | 13,826 | 12,664 | 69,565 | -11.5 | -3.4 | -20.8 | -11.9 |  |  |
 | February | 50,645 | 15,478 | 14,886 | 81,009 | 17.6 | 11.9 | 17.5 | 16.5 |  |  |
 | March | 53,280 | 17,348 | 15,798 | 86,426 | 5.2 | 12.1 | 6.1 | 6.7 |  |  |
 | April | 46,645 | 13,749 | 15,936 | 76,330 | -12.5 | -20.7 | 0.9 | -11.7 |  |  |
|  |  |
Seasonally Adjusted |  |  |
|  |  |
| 2004 | February | 48,993 | 13,206 | 16,014 | 78,213 | 0.5 | -5.5 | 3.5 | 0.0 |  |  |
 | March | 49,030 | 13,472 | 16,476 | 78,978 | 0.1 | 2.0 | 2.9 | 1.0 |  |  |
 | April | 48,572 | 13,531 | 15,837 | 77,940 | -0.9 | 0.4 | -3.9 | -1.3 |  |  |
 | May | 47,749 | 14,481 | 15,996 | 78,226 | -1.7 | 7.0 | 1.0 | 0.4 |  |  |
 | June | 49,538 | 14,447 | 15,451 | 79,436 | 3.7 | -0.2 | -3.4 | 1.5 |  |  |
 | July | 47,496 | 14,745 | 16,027 | 78,268 | -4.1 | 2.1 | 3.7 | -1.5 |  |  |
 | August | 48,319 | 14,842 | 15,854 | 79,015 | 1.7 | 0.7 | -1.1 | 1.0 |  |  |
 | September | 50,026 | 15,167 | 16,305 | 81,498 | 3.5 | 2.2 | 2.8 | 3.1 |  |  |
 | October | 51,564 | 15,432 | 16,419 | 83,415 | 3.1 | 1.7 | 0.7 | 2.4 |  |  |
 | November | 50,025 | 15,021 | 15,805 | 80,851 | -3.0 | -2.7 | -3.7 | -3.1 |  |  |
 | December | 47,930 | 14,431 | 16,117 | 78,478 | -4.2 | -3.9 | 2.0 | -2.9 |  |  |
 |  |  |  |  |  |  |  |  |  |  |  |
| 2005 | January | 52,355 | 15,943 | 17,056 | 85,354 | 9.2 | 10.5 | 5.8 | 8.8 |  |  |
 | February | 52,629 | 16,306 | 16,130 | 85,065 | 0.5 | 2.3 | -5.4 | -0.3 |  |  |
 | March | 50,312 | 15,918 | 15,597 | 81,827 | -4.4 | -2.4 | -3.3 | -3.8 |  |  |
 | April | 51,344 | 15,242 | 16,904 | 83,490 | 2.1 | -4.2 | 8.4 | 2.0 |  |  |
|  |  |
Trend |  |  |
|  |  |
| 2004 | February | 48,658 | 13,542 | 15,815 | 78,015 | -0.4 | 1.0 | 1.5 | 0.2 |  |  |
 | March | 48,592 | 13,687 | 15,948 | 78,227 | -0.1 | 1.1 | 0.8 | 0.3 |  |  |
 | April | 48,502 | 13,867 | 15,981 | 78,350 | -0.2 | 1.3 | 0.2 | 0.2 |  |  |
 | May | 48,395 | 14,118 | 15,952 | 78,465 | -0.2 | 1.8 | -0.2 | 0.1 |  |  |
 | June | 48,460 | 14,429 | 15,916 | 78,805 | 0.1 | 2.2 | -0.2 | 0.4 |  |  |
 | July | 48,701 | 14,718 | 15,904 | 79,323 | 0.5 | 2.0 | -0.1 | 0.7 |  |  |
 | August | 49,028 | 14,918 | 15,958 | 79,904 | 0.7 | 1.4 | 0.3 | 0.7 |  |  |
 | September | 49,439 | 15,043 | 16,077 | 80,559 | 0.8 | 0.8 | 0.7 | 0.8 |  |  |
 | October | 49,883 | 15,177 | 16,188 | 81,248 | 0.9 | 0.9 | 0.7 | 0.9 |  |  |
 | November | 50,291 | 15,332 | 16,248 | 81,871 | 0.8 | 1.0 | 0.4 | 0.8 |  |  |
 | December | 50,638 | 15,499 | 16,271 | 82,408 | 0.7 | 1.1 | 0.1 | 0.7 |  |  |
 |  |  |  |  |  |  |  |  |  |  |  |
| 2005 | January | 50,901 | 15,644 | 16,284 | 82,829 | 0.5 | 0.9 | 0.1 | 0.5 |  |  |
 | February | 51,132 | 15,752 | 16,307 | 83,191 | 0.5 | 0.7 | 0.1 | 0.4 |  |  |
 | March | 51,317 | 15,807 | 16,332 | 83,456 | 0.4 | 0.3 | 0.2 | 0.3 |  |  |
 | April | 51,430 | 15,819 | 16,371 | 83,620 | 0.2 | 0.1 | 0.2 | 0.2 |  |  |
|  |  |
| |  |  |
| |  |  |
Table 2: New Motor Vehicle Sales by State/Territory of Registration
|
 |  | NSW | Vic. | Qld | SA | WA | Tas.(a) | NT(a) | ACT(a) | Aust. |
 |  | (No.) | (No.) | (No.) | (No.) | (No.) | (No.) | (No.) | (No.) | (No.) |
|
Original |
|
| 2004 | February | 24,955 | 19,727 | 15,901 | 5,059 | 7,113 | 1,297 | 686 | 1,139 | 75,877 |
 | March | 28,118 | 22,137 | 18,611 | 5,561 | 8,086 | 1,343 | 912 | 1,278 | 86,046 |
 | April | 23,033 | 19,083 | 14,831 | 4,670 | 6,529 | 1,229 | 812 | 1,118 | 71,305 |
 | May | 25,649 | 20,106 | 16,373 | 5,215 | 7,296 | 1,513 | 918 | 1,209 | 78,279 |
 | June | 31,438 | 23,929 | 22,026 | 6,436 | 8,969 | 1,982 | 958 | 1,474 | 97,212 |
 | July | 25,031 | 19,410 | 17,141 | 4,949 | 7,228 | 1,449 | 646 | 1,181 | 77,035 |
 | August | 24,795 | 20,850 | 17,269 | 5,414 | 7,513 | 1,585 | 677 | 1,141 | 79,244 |
 | September | 25,241 | 20,821 | 17,188 | 5,289 | 8,177 | 1,855 | 739 | 1,142 | 80,452 |
 | October | 25,621 | 22,747 | 16,079 | 5,413 | 7,875 | 1,981 | 709 | 1,242 | 81,667 |
 | November | 26,619 | 23,052 | 17,117 | 5,450 | 8,157 | 1,944 | 694 | 1,302 | 84,335 |
 | December | 24,315 | 21,700 | 16,537 | 4,998 | 7,341 | 2,245 | 647 | 1,197 | 78,980 |
 |  |  |  |  |  |  |  |  |  |  |
| 2005 | January | 22,467 | 18,015 | 14,530 | 4,466 | 6,931 | 1,478 | 560 | 1,118 | 69,565 |
 | February | 25,754 | 20,580 | 17,837 | 5,489 | 7,880 | 1,431 | 776 | 1,262 | 81,009 |
 | March | 27,474 | 21,963 | 19,114 | 5,452 | 8,623 | 1,571 | 888 | 1,341 | 86,426 |
 | April | 24,329 | 19,497 | 16,789 | 5,034 | 7,329 | 1,371 | 858 | 1,123 | 76,330 |
|
Seasonally Adjusted |
|
| 2004 | February | 25,602 | 20,485 | 16,333 | 5,131 | 7,175 | 1,535 | 745 | 1,207 | 78,213 |
 | March | 25,839 | 20,381 | 16,815 | 5,218 | 7,361 | 1,402 | 771 | 1,191 | 78,978 |
 | April | 25,333 | 20,600 | 16,202 | 5,185 | 7,115 | 1,509 | 762 | 1,234 | 77,940 |
 | May | 25,085 | 20,355 | 16,590 | 5,193 | 7,491 | 1,541 | 783 | 1,188 | 78,226 |
 | June | 25,480 | 20,421 | 17,360 | 5,242 | 7,196 | 1,808 | 724 | 1,205 | 79,436 |
 | July | 25,229 | 19,759 | 17,139 | 5,053 | 7,619 | 1,569 | 689 | 1,211 | 78,268 |
 | August | 24,990 | 20,649 | 17,043 | 5,319 | 7,623 | 1,534 | 732 | 1,125 | 79,015 |
 | September | 25,586 | 20,994 | 17,263 | 5,421 | 8,418 | 1,801 | 809 | 1,206 | 81,498 |
 | October | 25,954 | 22,751 | 17,259 | 5,611 | 7,911 | 1,908 | 762 | 1,259 | 83,415 |
 | November | 25,553 | 21,445 | 16,943 | 5,262 | 8,028 | 1,677 | 710 | 1,233 | 80,851 |
 | December | 25,209 | 21,082 | 16,726 | 4,745 | 7,166 | 1,679 | 702 | 1,169 | 78,478 |
 |  |  |  |  |  |  |  |  |  |  |
| 2005 | January | 27,166 | 22,371 | 17,947 | 5,599 | 8,363 | 1,854 | 738 | 1,316 | 85,354 |
 | February | 27,199 | 21,716 | 18,426 | 5,642 | 8,143 | 1,730 | 860 | 1,349 | 85,065 |
 | March | 26,280 | 21,035 | 17,476 | 5,391 | 7,733 | 1,766 | 783 | 1,363 | 81,827 |
 | April | 26,319 | 21,278 | 18,562 | 5,467 | 8,287 | 1,621 | 782 | 1,174 | 83,490 |
 |  |  |  |  |  |  |  |  |  |  |
|
Trend |
|
| 2004 | February | 25,555 | 20,460 | 16,195 | 5,205 | 7,199 | 1,466 | 720 | 1,215 | 78,015 |
 | March | 25,525 | 20,433 | 16,424 | 5,189 | 7,221 | 1,484 | 743 | 1,208 | 78,227 |
 | April | 25,447 | 20,353 | 16,639 | 5,175 | 7,257 | 1,519 | 757 | 1,203 | 78,350 |
 | May | 25,334 | 20,274 | 16,827 | 5,175 | 7,330 | 1,566 | 763 | 1,196 | 78,465 |
 | June | 25,267 | 20,314 | 16,986 | 5,207 | 7,463 | 1,611 | 764 | 1,193 | 78,805 |
 | July | 25,261 | 20,490 | 17,088 | 5,255 | 7,624 | 1,655 | 760 | 1,190 | 79,323 |
 | August | 25,287 | 20,783 | 17,122 | 5,296 | 7,775 | 1,695 | 755 | 1,191 | 79,904 |
 | September | 25,391 | 21,151 | 17,122 | 5,328 | 7,900 | 1,725 | 748 | 1,194 | 80,559 |
 | October | 25,589 | 21,502 | 17,127 | 5,353 | 7,973 | 1,748 | 745 | 1,211 | 81,248 |
 | November | 25,845 | 21,727 | 17,190 | 5,372 | 7,994 | 1,764 | 744 | 1,235 | 81,871 |
 | December | 26,117 | 21,775 | 17,358 | 5,390 | 7,989 | 1,769 | 749 | 1,261 | 82,408 |
 |  |  |  |  |  |  |  |  |  |  |
| 2005 | January | 26,352 | 21,690 | 17,588 | 5,410 | 7,991 | 1,757 | 761 | 1,280 | 82,829 |
 | February | 26,526 | 21,571 | 17,831 | 5,441 | 8,017 | 1,738 | 775 | 1,292 | 83,191 |
 | March | 26,634 | 21,449 | 18,059 | 5,470 | 8,045 | 1,717 | 788 | 1,294 | 83,456 |
 | April | 26,686 | 21,283 | 18,264 | 5,492 | 8,106 | 1,698 | 801 | 1,290 | 83,620 |
 |  |  |  |  |  |  |  |  |  |  |
|
| (a) Seasonally adjusted numbers of new motor vehicle sales in Tasmania, Northern Territory and Australian Capital Territory should be used with caution. For further information, see paragraph 7 of the Explanatory Notes. |
|
 Print Page
 Print All