1. INTRODUCTION
HOURS WORKED
The Australian Bureau of Statistics (ABS) publishes indexes of hours worked in both the annual and quarterly national accounts. These indexes capture underlying trends in hours worked and are derived from estimates of hours actually worked by employed people. The ABS Labour Force Survey (LFS) provides the basic data from which these indexes are constructed.
The hours worked indexes published in the national accounts are important indicators in their own right as well as being fundamental building blocks required to estimate the indexes of labour productivity and multifactor productivity that are also published annually in the Australian System of National Accounts (cat. no. 5204.0). For these measurement purposes the time series of movements in hours worked from quarter to quarter and year to year were considered of good quality.
Measures of hours worked are also important in making international comparisons of economic performance, such as comparing GDP per capita across countries. To make such comparisons the actual level of hours worked in any period is required. For some time it has been recognised that the methodology underlying the aggregate actual hours worked data gives a measure that is biased upwards in level terms. Over the past year, the ABS has considered options for improving the methodology used for estimating hours worked. This work has focused on improving the annual measures of both total and average hours worked.
The various annual hours worked and labour productivity indexes presented in the 2005-06 release of 5204.0 have been constructed using the new estimates resulting from that work. This information paper is being released concurrently with the 2005-06 release of 5204.0 to provide users an update on the results of ongoing ABS productivity research program. Updated quarterly indexes reflecting the new methodology will be released on 6 December 2006 in the September quarter 2006 release of Australian National Accounts, National Income, Expenditure and Product (cat. no. 5206.0).
The remainder of this paper describes both the previous and new methods used for estimating hours worked and gives an overview of the effect of the change on the hours worked index, the level of hours worked and related productivity indexes.
2. METHODOLOGY FOR ESTIMATING HOURS WORKED
2.1. PREVIOUS METHOD: THE MID-QUARTER MONTH METHOD
The previous method (the method used to produce estimates published prior to the 2005-06 release of Australian System of National Accounts (cat. no. 5204.0) on 1 November 2006) was based on hours actually worked in the LFS reference periods for February, May, August and November. The hours worked reported in LFS relates to a week within the reference month(Footnote: Further details on the LFS data are in Appendix 1.). These four mid-quarter months were used for two reasons. The first and most important reason is that these months are relatively unaffected by non-random holidays (such as public holidays and school holidays) and so they tend to capture underlying trends in hours worked and are well suited to the production of an index. Secondly, the LFS only collects information by industry in these four mid-quarter months.
Using this method, total annual hours worked was calculated by:
- taking the average of total hours worked in the four mid-quarter months to estimate the number of hours worked per week
- dividing by seven to estimate the number of hours worked per day
- multiplying by 365.25 to estimate the total annual hours worked during the year.
This method results in an overestimate of total annual hours actually worked by employed people. The main cause of the overestimation is that the method makes no adjustment for hours not worked due to national public holidays and school holidays which are under-represented in the mid-quarter months. The method also excludes consideration of seasonal changes in hours worked, such as the relatively high hours worked in early December and relatively low hours worked in January.
2.2 NEW METHOD: BASED ON THE STATISTICS CANADA METHOD
The new method of estimating total annual hours worked is based on the methodology currently used by Statistics Canada. This method estimates total hours worked in all 52 weeks of the year from information on hours worked in all 12 LFS reference periods of the year. In comparison to the mid-quarter month method, which only uses four reference periods each year, the new method provides a better representation of hours actually worked across the year. This section highlights some of the main features of this new methodology. The new method is described in more detail in ABS Research Paper: Estimating Average Annual Hours Worked (cat. no. 1352.0.55.077).
Total annual hours worked are based on estimates of actual hours worked from the LFS. Total hours actually worked are observed in the LFS during the two week reference period of each month. However, the design of the LFS means that this two week reference period is only representative of 'one week' of each month. So, each reference period is assigned to one calendar week of the month. This provides 12 weeks of the year where total hours worked are observed.
Total hours worked in the remaining unobserved weeks of the year are imputed by interpolating linearly between the 12 observed weeks. Interpolation of the weeks at the beginning of January and at the end of December requires information on hours worked in the observed weeks of the previous December and the following January respectively.
Before total hours worked in a LFS reference period can be assigned to a calendar week, or be used as the basis of linear interpolation, they must be corrected for events such as public and school holidays. These non-random holidays tend to affect hours worked during the week containing the holiday rather than neighbouring weeks. Hours worked during a reference period affected by a non-random holiday may not be representative of hours actually worked in the assigned calendar week, nor will they be a good indicator of hours worked in neighbouring weeks. An estimate of the hours lost due to each observed non-random holiday can be made using intervention analysis.
Regression-ARIMA (Autoregressive Integrated Moving Average) intervention analysis is a technique that can be applied to estimate the effect of a known event on a regular time series. The parameter estimates from this type of analysis can be used to create a holiday corrected time series which excludes the impact of non-random holidays. Once these hours are appropriately accounted for, the holiday corrected estimates provide an appropriate basis for linear interpolation.
The corrected hours worked estimates still contain the effects of seasonal changes to hours worked from factors such as sick leave, annual leave and periods when hours worked tend to be high. The effects of seasonal factors on hours worked tend to be similar in neighbouring weeks, rather than being specific to one particular week.
The interpolation procedure results in an estimate of holiday-corrected total hours worked in each week of a year. To be representative of total hours actually worked in each week of the year, the hours lost due to non-random holidays need to be accounted for. For non-random holidays which are regularly observed in the LFS reference periods, the holiday correction obtained from intervention analysis can be weighted to be used to estimate the hours lost in each observed week. Hours lost from unobserved holidays are based on similar observed holidays. For example, the correction for Christmas is based on the observed correction for Easter.
The estimates of total hours actually worked in each week of the year are summed to create an estimate of monthly, quarterly or annual total hours worked. If the period does not start on a Monday, or end on a Sunday, total hours worked in the start, and/or end, week are apportioned to reflect this.
In order to obtain annual hours worked by industry it is necessary to make some simplifying assumptions, recalling that industry detail in the LFS is only available at the mid-quarter months. This mid-quarter month information is used to estimate the proportion of total hours worked by people employed in each industry in each of these four months. These quarterly proportions are weighted together to provide an annual proportion of total hours worked for each industry. Applying this proportion to total annual hours worked by all employed people gives an annual hours worked estimate for each industry. This method implicitly assumes that the effects of holidays and other seasonal factors are constant across all industries. The ABS intends to investigate ways to improve this aspect of the methodology.
For a more detailed description of the new hours worked method refer to Appendix 2.
3. ANALYSIS OF THE TWO HOURS WORKED METHODS
INTRODUCTION
This section examines the impact of the new hours worked measures on levels of hours worked and movements in hours worked.
Estimates of the level of hours worked are not published by the ABS but are provided to the Organisation for Economic Cooperation and Development (OECD) as part of its annual national accounts questionnaire. The impact of the new method is analysed below by comparing the new results to those previously provided to the OECD. The new data have been provided to the OECD and will form the basis for future international comparison work.
The comparison of movements in hours worked estimated using the new and previously used methods uses data from Australian System of National Accounts, 2004-05 (cat. no. 5204.0). The new estimates only incorporate the new hours worked estimates and do not include the effect on any other revisions to the national accounts.
Estimates derived using the new hours worked method are currently available from 1987-88 to 2004-05. Historical data have been spliced on to these estimates to maintain the existing time series. The impact of the new estimates on the ABS productivity measures is discussed in this section. A description of the ABS productivity measures is presented in section 4.
3.1 LEVEL OF HOURS WORKED
The figure below shows estimates of average annual hours worked using both the new and previously used methods. The new estimates are substantially lower than the previously used estimates.
Average Annual Hours worked
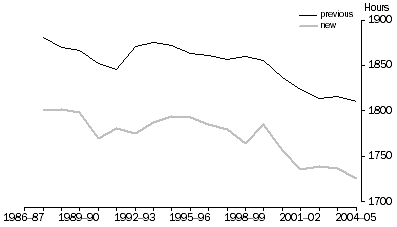
In general, movements in the new series are similar to the previous estimates, but there are some differences in turning points. For example, during the early 1990s the previous estimates fell between 1988-89 and 1993-94. The new estimates do show a slow decline from 1989-90 but hours worked begins to increase earlier than the previous estimates.
Other differences between the two series include a notable rise in the estimates during 1999-00 which does not appear in the previous estimates. An analysis of the quarterly and monthly data showed that this rise in hours worked in the revised series is at least partly due to the effects of the Millennium New Year and the Sydney Olympics.
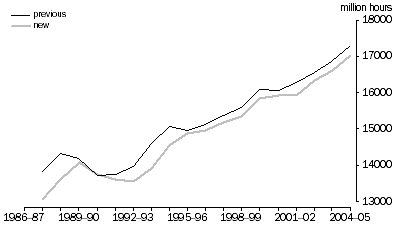
The figure below compares estimates of total annual hours worked using the two methods. Again, the new estimates are consistently below the previous estimates with the exception of 1990-91. These two series also show fairly similar patterns over time.
Total Annual Hours worked
GDP per Hours worked
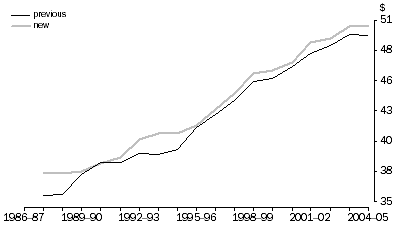
The figure above shows how estimates of total annual hours worked calculated using the two different methods affects GDP per hour worked. Since estimates of total annual hours worked are generally lower when the new method is used, GDP per hour worked on the new basis is consistently higher with the exception of 1990-91.
3.2 MOVEMENTS IN HOURS WORKED
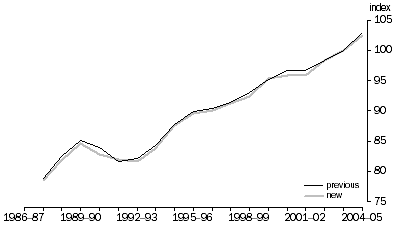
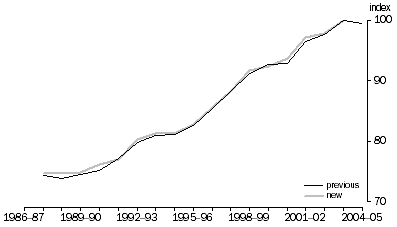
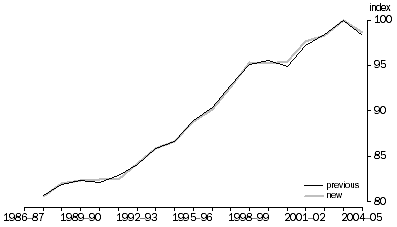
The following graph presents total hours worked for all industries indexes based on the new and the previous method. While there are some differences they are relatively minor and the trend pattern remains the same.
Total hours worked for all industries, Index 2003-04 = 100
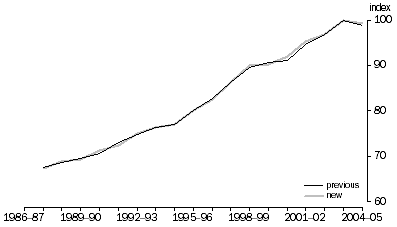
The graph below presents GDP per hour worked for the total economy. As per the above graph, while there are some minor differences in movements, most notably around the late 1980s and early 1990s, the trends remain the same.
GDP per hour worked, All industries - Index 2003-04 = 100
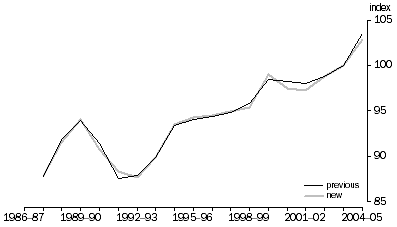
The next two graphs present market sector hours worked and labour productivity respectively. The first shows some differences in the movements between the two series around 1991-92 and 2001-2002. However, these differences are not as marked in the labour productivity estimates.
Market sector hours worked, Index 2003-04 = 100
One point to note in the following graph is that the decline in labour productivity over 2004-05 is smaller using the new hours worked method than the previously used method.
Market sector labour productivity, Index 2003-04 = 100
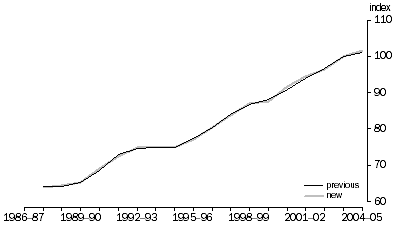
This next graph shows the capital labour ratio for the market sector, again the impact of the new hours worked estimates is only minimal.
Market sector capital labour ratio, Index 2003-04 = 100
With little impact of the new hours worked method on the other productivity series, as expected there is also little difference when comparing the two MFP series as shown below.
Market sector multifactor productivity, Index 2003-04 = 100
One other aspect important in the analysis of productivity concerns productivity growth cycles. As there has been little change to the series the productivity growth cycles remain unchanged. Further there was no change in trend growth rates over these productivity cycles.
Annual industry level data are not presented here because there were only minor differences in movements between the hours worked estimates produced by the previous method and new method.
4. PRODUCTIVITY MEASURES PUBLISHED BY THE ABS
INTRODUCTION
The ABS publishes a number of productivity measures in the Australian System of National Accounts (cat. no. 5204.0) as well as in the quarterly National Income, Expenditure and Product (cat. no. 5206.0) release. These measures include:
- Labour productivity and related measures
- Capital productivity for the market sector
- Multifactor productivity (MFP) for the market sector.
For more information refer to Australian National Accounts: Concepts, Sources and Methods (cat. no. 5216.0) Chapter 27.
Changes to hours worked measures do not affect the capital productivity measures so the following discussion focuses on the impact of the new methodology on labour productivity and MFP estimates.
4.1 LABOUR PRODUCTIVITY AND RELATED MEASURES
The ABS publishes a number of indexes that summarise the change in the output of the national economic production process with the change in the inputs associated with that production. Hours worked are the best indicator of the labour input into production. Labour productivity indexes are a useful way of summarising the respective growth rates of the outputs from production with the inputs into that process. The degree to which growth in output exceeds growth in inputs is often interpreted as an improvement in the efficiency of the production system.
The labour productivity estimates published by the ABS are an index of the change in the volume of output per hour worked. Indexes of this form are published in respect of the total economy and the market sector(Footnote: The market sector is a subset of the total economy as it includes only the following industries: Agriculture, forestry & fishing, Mining, Manufacturing, Electricity, gas & water, Construction, Wholesale trade, Retail trade, Accommodation, cafes & restaurants, Transport & storage, Communication, Finance & insurance, and Cultural & recreational services.). The change in the volume of output for the total economy is given by the chain volume measure of GDP (see Appendix 1 for more details). The volume of output for the market sector is the chain volume measure of gross value added (incorporating taxes on products) for those industries in the market sector. The hours worked component is derived from the LFS, with industry data available in the mid-quarter months.
The ABS also publishes annual indexes of labour productivity by industry for all industries except Property & business services, Government administration & defence, Education, and Personal & other services.
Hours worked measures
The ABS publishes hours worked indexes at the economy-wide, the market sector and industry levels annually. These series are also used as inputs to estimates of labour productivity and MFP. Market sector hours worked are calculated by subtracting non-market sector industries’ hours worked from the economy-wide total hours worked.
The new hours worked method has been implemented directly into the productivity measures. The new total hours worked is estimated for all industries, that is, the total economy. To estimate total hours worked for the market sector requires industry estimates. The steps used to derive the industry estimates of hours worked were:
- to obtain total hours worked in each of the mid-quarter months in each industry, and for the total of all industries from LFS
- for each mid-quarter month calculate the proportion of total hours worked in an industry of total hours worked for all industries
- to obtain an annual ratio by averaging these four proportions for the financial year
- to calculate the industry annual hours estimate by multiplying the annual proportion for an industry, to the total hours worked for all industries.
In addition to the annual hours worked estimates, the ABS publishes quarterly hours worked indexes for the total economy and the market sector. The quarterly estimates will also be compiled on the basis of the new methodology. Updated quarterly indexes reflecting the new methodology will be released on 6 December 2006 in the September quarter release of Australian National Accounts, National Income, Expenditure and Product (cat. no. 5206.0). Further investigations are being undertaken to implement the new hours worked methodology into the quarterly hours worked indexes.
Quality adjusted labour input (QALI) measures
Neither the former or the new measures of hours worked account for changes in the quality of labour. Thus, when compiling productivity estimates, changes in aggregate labour quality are ascribed to changes in MFP. The ABS has compiled an experimental annual quality-adjusted series for hours worked. The essential features of the method are to construct a chain-weighted quality adjusted index of hours worked from an array of weighting factors that reflect the differential quality of labour. The method used to compile the index is described in the September quarter 2001 issue of the quarterly national accounts (National Income, Expenditure and Product (cat. no. 5206.0)).
Recent movements in the QALI are linked to movements in hours worked and have therefore been affected by the new method to a small degree. Benchmarks for the QALI are independently derived and unaffected by the new hours worked method. The most recent benchmark was for 2002-03.
Capital / labour ratio
The ABS also publishes the capital / labour ratio index as part of its productivity estimates. This measure is the ratio of capital inputs index to labour inputs index and is a measure of capital intensity.
4.2 MARKET SECTOR MFP
The ABS publishes MFP estimates for the market sector. MFP measures the ratio of output to two or more factor inputs. The term MFP is used in preference to total factor productivity, as not all changes in all inputs are taken into account. MFP represents that part of the change in output that cannot be explained by changes in the inputs. The ABS approach for measuring MFP is based on neoclassical theory using a translog production function in conjunction with two assumptions, constant returns to scale and the marginal products of capital and labour being equal to their respective real market prices. The estimates are derived by dividing the index of the chain volume measure of gross value added by a combined labour and capital chain volume index.
The inputs index is an income weighted chain Tornqvist index of the capital and labour inputs. That is, the change is a measure of the growth in the ratio of real value added to the combination of two factor inputs, capital and labour. The income weights are derived from Gross operating surplus, Compensation of employees and splitting Gross mixed income into its labour and capital returns.
Productivity growth cycles
The ABS also publishes estimates on MFP growth cycles that are termed the growth accounting approach to productivity analysis. Growth cycles are formed for market sector MFP. These growth cycles are formed on a peak-to-peak basis. To detect peaks a long-term trend is formed using an 11-term Henderson moving average. The difference between the original series and the long-term trend is used to detect peaks. The reason for forming productivity growth cycles is that when comparing average growth rates between peaks, it is assumed that they have similar levels of capacity utilisation, which is important when analysing growth in productivity. The growth cycles analysis is presented in table 23 of Australian System of National Accounts (cat. no. 5204.0).
Any changes to hours worked would need to be significant to alter these growth cycles. However, there could be changes to the MFP growth rates. The issue of interest for productivity estimates that use labour inputs as a variable is the effect of the change to the movements within the series rather than changes to the level.
5. CONCLUSION
CONCLUSION
The hours worked indexes and indexes of labour productivity and MFP published by the ABS in the national accounts are important economic indicators. Measures of the level of hours worked are also important for making international comparisons of economic performance.
The new method for estimating hours worked, based on a Statistics Canada methodology, is a conceptual improvement over the method previously used to produce the hours worked level estimates. The new method for estimating hours worked, both at the aggregate and industry level, produce more accurate level estimates, and therefore provide a more reliable base for the measurement of changes in hours worked.
Using the new method of estimating the level of hours worked, there is a reasonably large fall in the total number of hours worked but the index of total hours worked shows little change when compared to the previous method. Thus there is little impact on annual productivity growth rates or on the identification of peaks in productivity growth cycles.
 Print Page
 Print All