|
|
ANNUAL MANUFACTURING INDUSTRY COLLECTION
The 1999-2000 collection was conducted as a sample survey of approximately 17,000 manufacturing establishments nationally, which were requested to provide data on employment, wages and salaries, turnover, purchases and whether their products were exported. A sub-sample of approximately 7,000 establishments was also asked to provide detailed structural and performance data, and value of sales for commodities produced.
ABOUT THIS ISSUE
The 1999-2000 series of these publications, Manufacturing Industry, Australia (Cat. no. 8221.0) and Manufacturing Industry, [State], (Cat. nos 8221.1-8221.6) will be the last that present data for manufacturing establishments. Future manufacturing collections will no longer collect data from manufacturing establishments. Starting with the 2000-01 manufacturing collection, data will be sought from a sample of approximately 9,000 manufacturing businesses nationally. For more details, see the Appendix.
The ABS continues to use Australian Taxation Office (ATO) information on group employer (GE) registrations to delete from the ABS business register those businesses which have ceased trading or are no longer employing staff. The ABS has for some time used GE information to add new businesses to the business register; however, GE information to delete businesses from the business register was first used for the 1998-99 collection. For more details, see paragraphs 12-14 of the Explanatory Notes.
REGIONAL DATA
For information about the availability of sub-State estimates from the 1999-2000 collection, see paragraph 27 of the Explanatory Notes.
DATA TO BE RELEASED IN OTHER PUBLICATIONS
Detailed manufacturing industry statistics for each State are being released progressively in a series of publications, Manufacturing Industry, [State], 1999-2000 (Cat. nos 8221.1-8221.6). The publication for New South Wales (Cat. no. 8221.1) also contains selected data for the Australian Capital Territory.
Management unit data and a wide range of manufacturing related ABS data, as well as data from other sources, will be presented in the compendium publication Manufacturing, Australia, 2001 (Cat. no. 8225.0), to be released in December 2001. Management unit data at the total manufacturing level are also included in Business Operations and Industry Performance, Australia, 1999-2000 (Cat. no. 8140.0).
MAIN FEATURES
OVERVIEW
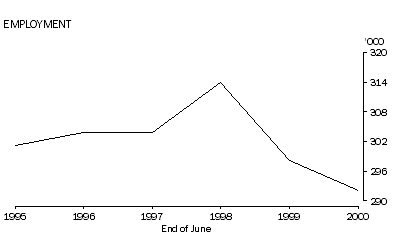
Turnover for the year 1999-2000 by manufacturing establishments operating in Victoria was $74,312m, which resulted in an industry value added (IVA) for the year of $22,159m. For turnover, this represents a 3.0% increase in current price terms from the $72,120m recorded for 1998-99. These manufacturing establishments employed 292,100 persons at the end of June 2000 and paid $11,679m in wages and salaries in 1999-2000.
The percentage of Australian manufacturing employment in Victoria at the end of June 2000 was 32.1%, a decrease of 0.3 percentage points on that reported at the end of June 1999. The Victorian industry subdivisions which made a significant contribution to national manufacturing employment at the end of June 2000 at the industry subdivision level were Textile, clothing, footwear and leather manufacturing (51.5%), Petroleum, coal, chemical and associated product manufacturing (39.1%) and Machinery and equipment manufacturing (34.6%).
The percentage contribution by Victoria to total Australian manufacturing turnover and IVA in 1999-2000 was 32.5% and 32.4% respectively. This represents a decrease of 0.3 percentage points on the contribution reported in 1998-99 for turnover and a decrease of 0.7 percentage points for IVA. The Victorian industry subdivisions which made a significant contribution to national manufacturing turnover and IVA in 1999-2000 at the industry subdivision level were also Textile, clothing, footwear and leather manufacturing (48.5% and 52.3% respectively), Machinery and equipment manufacturing (41.0% and 38.0% respectively) and Petroleum, coal, chemical and associated product manufacturing (35.4% and 38.7% respectively).
STATE/TERRITORY COMPARISON
In 1999-2000, the contribution of Australian turnover by Victorian manufacturers ($74,312m) exceeded that of manufacturers located in New South Wales ($73,259m) for the fourth consecutive year. When this first occurred, for 1996-97, it was the first time that this had happened since the commencement of integrated economic statistics with the 1968-69 collection.
Between them, Victoria (at 32.4%) and New South Wales (at 33.7%) contributed nearly two-thirds of manufacturing IVA for Australia in 1999-2000. The contribution of the other States and Territories in 1999-2000 was: Queensland (14.0%), South Australia (9.0%), Western Australia (7.4%), Tasmania (2.6%), Northern Territory (0.5%) and Australian Capital Territory (0.4%). This ranking of the States and Territories was unchanged from the previous year.
This is the third consecutive year that employment in the Victorian manufacturing industry has exceeded that for New South Wales. There is, however, a decrease of 0.3 percentage points for Victoria and a decrease of 0.1 percentage points for New South Wales on their contribution to national manufacturing employment recorded 12 months earlier, such that the gap has now narrowed considerably, with each State contributing 32.1% to Australian manufacturing employment. Queensland decreased its contribution by 0.1 percentage points (to 15.6%) and South Australia and Western Australia both increased their contribution by 0.2 percentage points (to 9.2% and 8.0% respectively). The contribution of Tasmania and the Territories remained the same over this period.
INDUSTRY VALUE ADDED
IVA for 1999-2000 was $22,159m. The industry subdivisions with the largest contribution to total manufacturing IVA and the most notable industry classes (where publishable) or groups within those subdivisions (as a percentage of Victoria's total manufacturing IVA) were:
- Machinery and equipment manufacturing (22.4%), where the industry group Motor vehicle and part manufacturing (ANZSIC Group 281 at 10.3%) was the most substantial.
- Food, beverage and tobacco manufacturing (19.2%), where the industry classes Dairy product manufacturing n.e.c. (ANZSIC Class 2129 at 3.5%), Fruit and vegetable processing (ANZSIC Class 2130 at 1.9%) and Wine manufacturing (ANZSIC Class 2183 at 1.7%) were the most substantial.
- Petroleum, coal, chemical and associated product manufacturing (17.1%), where the industry classes Medicinal and pharmaceutical product manufacturing (ANZSIC Class 2543 at 2.9%), Petroleum refining (ANZSIC Class 2510 at 2.1%) and Plastic injection moulded product manufacturing (ANZSIC Class 2566 at 2.1%) were the most substantial.
- Metal product manufacturing (11.9%), where the industry class Basic iron and steel manufacturing (ANZSIC Class 2711 at 2.2%) was the most substantial.
Industry classes making a notable contribution to industry value added and not included in the subdivisions listed above included Printing (ANZSIC Class 2412 at 3.8%) and Newspaper printing or publishing (ANZSIC Class 2421 at 3.2%).
The Victorian manufacturing industry subdivisions in 1999-2000 with the highest IVA per person employed were Petroleum, coal, chemical and associated product manufacturing at $102,200 per person employed and Non-metallic mineral product manufacturing (at $98,200).
EMPLOYMENT AND WAGES
The Victorian manufacturing industry employed 292,100 persons at the end of June 2000 and paid $11,679m in wages and salaries in 1999-2000. This represents an average of $40,000 paid in annual wages and salaries per person employed at the end of June 2000, an increase of 3.1% on the $38,800 recorded twelve months earlier. (Readers should note that the employment figure in this average measures the number of persons employed at the end of June and includes working proprietors. The wages and salaries figure excludes the drawings of working proprietors.)
- Non-metallic mineral product manufacturing (up 12.7% - from $39,000 to $43,900), where 9 (out of 11) industry classes recorded an increase;
- Printing, publishing and recorded media (up 6.1% - from $37,500 to $39,800), where 4 (out of 7) industry classes recorded an increase; and
- Metal product manufacturing (up 5.8% - from $38,300 to $40,500), where 15 (out of 20) industry classes recorded an increase.
Industry classes (where publishable) which had the largest percentage increases between 1998-99 and 1999-2000 in wages and salaries paid per person employed at the end of June were Copper, silver, lead and zinc smelting, refining (ANZSIC Class 2723) (up 64.4% - from $24,900 to $40,900), Concrete slurry manufacturing (ANZSIC Class 2633) (up 49.1% - from $27,700 to $41,200), Ceramic product manufacturing n.e.c. (ANZSIC Class 2629) (up 29.8% - from $26,100 to $33,900) and Other periodical publishing (ANZSIC Class 2422) (up 29.1% - from $32,300 to $41,800).
The industry subdivision to record the decrease between 1998-99 and 1999-2000 in wages and salaries paid per person employed at the end of June was Textile, clothing, footwear and leather manufacturing (down 0.6% - from $29,700 to $29,500).
TURNOVER
Turnover rose, in current price terms, by $2,191m to $74,312m for 1999-2000. This represents a 3.0% increase on the $72,120m recorded for 1998-99.
Machinery and equipment manufacturing (at 24.2%) is again the largest contributor to total Victorian manufacturing turnover, as it has been every year since ANZSIC industry data were introduced for 1989-90. Food, beverage and tobacco manufacturing (21.6%) remained the second largest contributor to total Victorian manufacturing turnover. All other industries were also ranked in the same order as they were in 1998-99.
Seven of the nine manufacturing industry subdivisions recorded an increase in turnover between 1998-99 and 1999-2000 and the other two decreased. The largest increase in percentage and dollar terms was recorded by Petroleum, coal, chemical and associated product manufacturing (up 12.4% or $1,407m). Wood and paper product manufacturing recorded the second largest percentage increase (up 11.1% or $389m). The two industry subdivisions to record a fall in turnover were Textile, clothing, footwear and leather manufacturing (down 10.5%) and Other manufacturing (down 7.4%).
The industry classes with the largest percentage increases (where publishable) between 1998-99 and 1999-2000 were:
- Basic non-ferrous metal manufactuuring n.e.c. (ANZSIC Class 2729) (up 133.8% or $9m);
- Plastic product rigid fibre reinforced manufacturing (ANZSIC Class 2564) (up 81.1% or $158m); and
- Ceramic product manufacturing (ANZSIC Class 2622) (up 75.6% or $15m).
The industry classes with the largest dollar increases (where publishable) between 1998-99 and 1999-2000 were:
- Plastic injection moulded product manufacturing (ANZSIC Class 2566) (up $358m or 36.0%);
- Dairy product manufacturing n.e.c. (ANZSIC Class 2129) (up $280m or 8.9%); and
- Petroleum refining (ANZSIC Class 2510) (up $255m or 15.3%).
The industry classes with the largest percentage decreases between 1998-99 and 1999-2000 were:
- Copper, silver, lead and zinc smelting, refining (ANZSIC Class 2723) (down 42.3% or $31m);
- Household appliance manufacturing (ANZSIC Class 2851) (down 36.1% or $247m); and
- Women's and girls' wear manufacturing (ANZSIC Class 2242) (down 30.4% or $155m).
The industry classes with the largest dollar decreases between 1998-99 and 1999-2000 were:
- Household appliance manufacturing (ANZSIC Class 2851) (down $247m or 36.1%);
- Wooden furniture and upholstered seat manufacturing (ANZSIC Class 2921) (down $171m or 18.0%); and
- Electrical cable and wire manufacturing (ANZSIC Class 2852) (down $160m or 26.5%).
EXPORTS
For 1999-2000, Victorian manufacturers directly exported $10,373m of the goods that they produced. This represents a 16.6% increase on the $8,897m recorded for 1998-99. Exports as a proportion of total sales and transfers out of goods produced has increased from 13.2% for 1998-99 (the series low point) to 15.0% for 1999-2000, which represents a series high point.
Manufacturers' direct exports increased in six industry subdivisions and decreased in the other three between 1998-99 and 1999-2000. The industry subdivisions to record the largest dollar increases in direct exports between 1998-99 and 1999-2000 were Food, beverage and tobacco manufacturing (up $712m or 25.3% - from $2,807m to $3,519m) and Machinery and equipment manufacturing (up $529m or 18.6% - from $2,846m to $3,375m). The industry subdivision to record the largest percentage increase was Other manufacturing (up 97.8% or $44m - from $45m to $90m). The largest dollar decreases in direct exports were recorded by Petroleum, coal, chemical and associated product manufacturing (down $33m or 3.0% - from $1,081m to $1,048m) and Non-metallic mineral product manufacturing (down $31m or 36.6% - from $84m to $53m).
Direct exports by establishments employing 100 or more persons increased by $1,066m (or 15.9%), establishments employing 0 to 49 persons by $225m (or 16.5%) and establishments employing 50 to 99 persons by $185m (or 21.7%).
|
 Print Page
 Print All