MARCH KEY FIGURES
 | Mar Qtr 2009 | Dec Qtr 2009 | Mar Qtr 2010 |
| CONSOLIDATED ASSETS | $m | $m | $m |
|
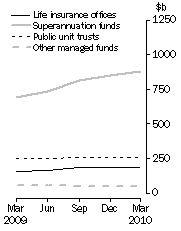
| Superannuation funds | 691 061 | 846 377 | 877 850 |
| Public unit trusts | 249 542 | 259 385 | 262 263 |
| Life insurance offices(a) | 157 959 | 181 843 | 181 819 |
| All other managed funds | 56 112 | 47 912 | 46 129 |
| Total | 1 154 674 | 1 335 516 | 1 368 061 |
|
| (a) Investments by superannuation funds which are held and administered by life insurance offices are included under life insurance offices. |
| Note: See note on consolidation in Explanatory Notes, paragraph 11. |
Consolidated Assets, Type of institution
| Consolidated Assets, Type of asset
|
MARCH KEY POINTS
CONSOLIDATED ASSETS
- At 31 March 2010, total consolidated assets of managed funds institutions was $1,368.1b, an increase of $32.5b (2%) on the December quarter 2009 figure of $1,335.5b.
- Consolidated assets of superannuation funds increased $31.5b (4%); public unit trusts increased $2.9b (1%); common funds decreased $0.1b (1%); cash management trusts decreased $1.7b (4%); and life insurance offices and friendly societies remained virtually the same.
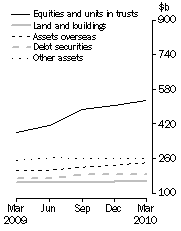
- The asset types to increase for the quarter were equities and units in trusts, $17.4b (3%); assets overseas, $11.1b (5%); land and buildings, $2.8b (2%); long term securities, $1.4b (2%); loans and placements, $0.8b (2%) and cash and deposits, $0.5b (0.3%). The asset types to decrease were short term securities, $1.4b (1%) and other assets, $0.1b (0.2%). The main valuation effects that occurred during the March quarter 2010 were: the S&P/ASX 200 increased 0.1%, the price of foreign shares (represented by the MSCI World Index) increased 2.7%, and the A$ appreciated 2.1% against the US$.
- At 31 March 2010, investment managers had $1,156.9b in funds under management, up $18.3b (2%) on the December quarter 2009 figure of $1,138.6b. They managed $785.3b (57%) of the consolidated assets of managed funds institutions.
NOTES
FORTHCOMING ISSUES
| ISSUE (QUARTER) | Release Date |
| June 2010 | 26 August 2010 |
| September 2010 | 25 November 2010 |
| December 2010 | 25 February 2011 |
| March 2011 | 26 May 2011 |
REVISIONS IN THIS ISSUE
There have been revisions in some series as a result of the receipt of revised administrative data and revised survey data. Superannuation data have been revised back to September quarter 2006, life insurance offices data have been revised back to December quarter 2009 and investment manager data have been revised back to June quarter 2008.
CHANGES IN THIS ISSUE
As advised in the previous issue, time series spreadsheets for tables 9 through 19 will be released one week after the release of the publication (pdf file) due to confidentiality and quality assurance processes.
INQUIRIES
For further information about these and related statistics, contact the National Information and Referral Service on 1300 135 070 or Judy Sykes on Canberra (02) 6252 5222.
 Print Page
 Print All