Education News - ABS Education Services
This newsletter highlights the latest curriculum related teaching resources, student activities and statistical tools that have been developed by ABS Education Services as well as other ABS resources that are useful for schools.
Contents
- Census 2006 - Census Tables
- Victorian Spatial Excellence Award
- An Idea for the Classroom
- International Statistical Literacy Competition
- CensusAtSchool
- Did You Know ..?
- Recent Publications
Census 2006 - Census Tables
Data from Census 2006 is being released in new, easy to use formats. In the last two newsletters we have shown you how to use QuickStats and MapStats. Another new, easy-to-use product is Census Tables. These are an easy way to
access data for a particular geographic area about
a specific topic. For example, you may want to compare the amount of voluntary work done by different age groups, or by males opposed to females, or by both
age group and sex.
 |
Here is how to do it.
- Go to the ABS Census home page (www.abs.gov.au/census).
- Choose Census Tables.
- You will be asked to choose whether you want to search by Location or by Topic. For this example, choose 'by Topic' and press 'Next'.
- Choose the 'count method'. 'Place of Usual Residence' is the default option for 2006 Census data. It is used in the example below. (For the 2006 Census, 'Place of Usual Residence' replaced 'Location on Census Night' as the default option.) Always check the count method, especially when making comparison with earlier census data.
- Select a topic from the drop down list. In the example, 'Voluntary Work' has been selected.
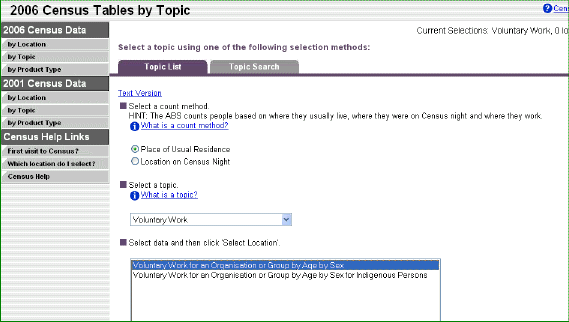
- Select the data table that you want from the list that appears and scroll down to 'Select Location'.
- Type in the location of interest. Press the Search button. A list will be generated of all areas bearing that name.
- Scroll through the list and highlight the location required. A map will appear. Check that this map represents the area of interest.
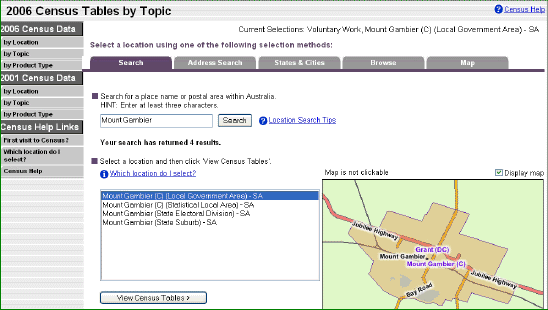
- Choose 'View Census Tables'.
- You will see the page below. This will give the 'Summary' page of the area of interest. To obtain the Census Table (an Excel spreadsheet) choose the 'Details' tab. (As shown in diagram below)
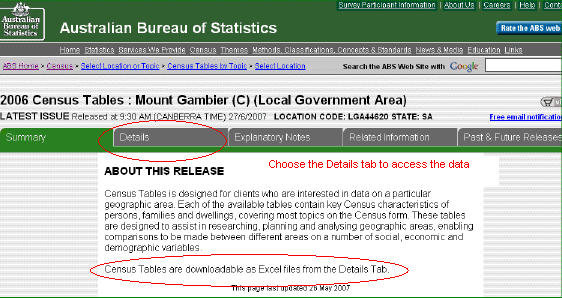
- Download the Excel file.
Tables are available for key Census characteristics such as: persons, families and dwellings. These cover most topics on the Census form.
If you have developed classroom activities using Census data, let us know (education@abs.gov.au). We can share it with teachers around Australia by posting it on our web site.
Next time: Community Profiles
Victorian Spatial Excellence Award
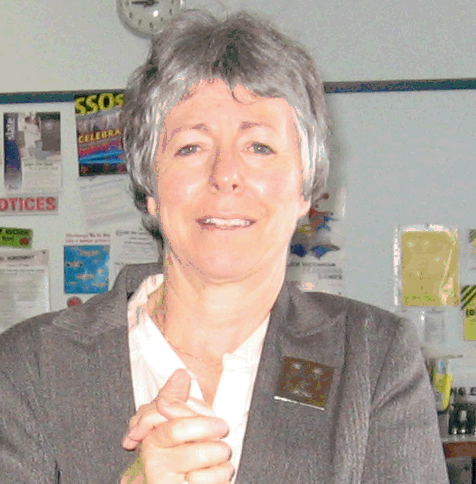 Pat Beeson is a teacher consultant in ABS Education Services Unit. Prior to joining the ABS, Pat was Head of Geography at Presbyterian Ladies' College in Melbourne. On 18 September, she was awarded a Victorian Spatial Excellence Award for her contribution to the implementation of spatial technologies within the curriculum. Pat Beeson is a teacher consultant in ABS Education Services Unit. Prior to joining the ABS, Pat was Head of Geography at Presbyterian Ladies' College in Melbourne. On 18 September, she was awarded a Victorian Spatial Excellence Award for her contribution to the implementation of spatial technologies within the curriculum.
Pat's passion for the power of spatial representation has continued with the work she is doing at ABS, focussing particularly on Census data.
Congratulations Pat!
An Idea for the Classroom
Children Involved in Selected Activities
In the last Education News we discussed how you could use the 'Migration Data Set' in the classroom. Another useful dataset is 'Children Involved in Selected Activities'. (See (Catalogue No. 4901.0) for a more comprehensive view of this data set.) The data summarises the participation rates of girls and of boys in a variety of sporting and other activities outside school hours for the years 2000, 2003 and 2006. Useful classroom activities using this data set, could include i) drawing comparisons between girls' and boys' participation rates in sporting activities, ii) examining how the various activity types vary over time, iii) hypothesising whether time spent on computers affects the time spent doing physical activities.
A simple activity might be: What are the most popular organised sporting activities for boys and for girls? What sports are popular with both girls and boys? What reasons could be given for this?
A good starting point might be to examine the participation rate of girls and of boys in organised sporting activities. The following column chart gives the participation rate (%) of the seven most popular organised sporting activities for boys and for girls.
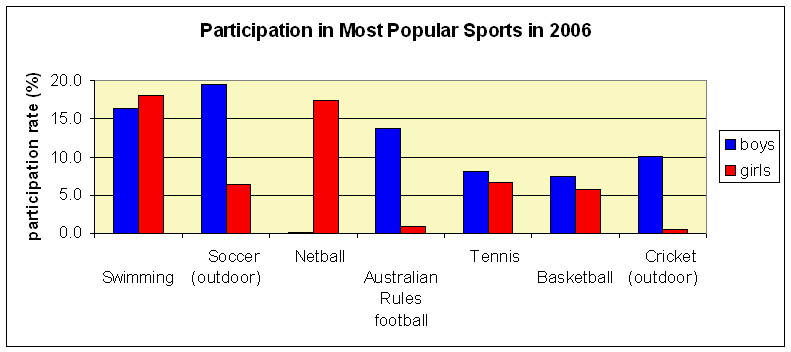
A similar column chart could be drawn from the same data set; for example skateboarding, bike riding and reading for pleasure.
CensusAtSchool: Questions 33, 34 and 35 from the CensusAtSchool 2006 Questionnaire asked students across Australia similar questions regarding the time spent on computers and playing outdoor games. Comparisons between the 'Children Involved in Selected Activities' data base and a random sample taken from the CensusAtSchool data base would add an extra dimension to the investigation.
Do you have a classroom idea that uses ABS data or ABS Education products? Let us know at education@abs.gov.au and we'll share it around Australia.
International Statistical Literacy Competition.

 Get your students involved in the International Statistics Literacy Competition. The competition is coordinated by the International Statistical Literacy Project (ISLP) of the International Association for Statistics Education (an ISI Section). The competition is open to students aged 10 to 18 from any country. There is no cost to enter the competition and there are different categories according to age. A teacher must register for the students and all contact will be through the teacher. Sample games for preparing students to compete will be provided by the ISLP. Get your students involved in the International Statistics Literacy Competition. The competition is coordinated by the International Statistical Literacy Project (ISLP) of the International Association for Statistics Education (an ISI Section). The competition is open to students aged 10 to 18 from any country. There is no cost to enter the competition and there are different categories according to age. A teacher must register for the students and all contact will be through the teacher. Sample games for preparing students to compete will be provided by the ISLP.
The main objective of this competition is to encourage school students to become interested in statistical data analysis and show them how statistics can help make sense of the information that surrounds them in their daily life. Another objective is to promote and encourage teachers and students to use the statistical literacy resources that exist in their countries.
 Teachers who register their students will be contacted with further instructions and practice materials. For further information and to register, visit the competition's web site: www.stat.auckland.ac.nz/~iase/islp/competition Teachers who register their students will be contacted with further instructions and practice materials. For further information and to register, visit the competition's web site: www.stat.auckland.ac.nz/~iase/islp/competition
CensusAtSchool
 Planning for CensusAtSchool 2008 is well under way. From early next year, your students will be able to complete the 2008 questionnaire, which will include 11 international questions. Don't forget CensusAtSchool is suitable for use in classes from Grade 5 to Year 12 and from Maths to Geography, Health to Commerce, and Science to PE. Register now for 2008 if you wish your students to participate in the questionnaire phase. (Schools registered for 2006 do not need to re-register.) Planning for CensusAtSchool 2008 is well under way. From early next year, your students will be able to complete the 2008 questionnaire, which will include 11 international questions. Don't forget CensusAtSchool is suitable for use in classes from Grade 5 to Year 12 and from Maths to Geography, Health to Commerce, and Science to PE. Register now for 2008 if you wish your students to participate in the questionnaire phase. (Schools registered for 2006 do not need to re-register.)
Over a quarter of all Australian schools completed CensusAtSchool 2006 and there are more than 112,000 student responses that you can access now via the Random Sampler. Because CensusAtSchool is such a flexible resource, teachers are using it across the curriculum and from Grade 5 to Year 12. You can access CensusAtSchool directly from www.abs.gov.au/censusatschool. There is also a free DVD and CD to help you use this invaluable resource. Contact the CensusAtSchool team to receive your copy.
|  |
Did you know...?
According to the latest edition of Schools, Australia 2006 (cat.no.4221.0):
- The number of part-time students in 2006 was down by 2.2% from 2005, whilst the number of full-time student rose slightly by 1.2% from 2005.
- The Northern Territory had the highest proportion of part-time students (3.0%), followed by South Australia with 2.8% and Tasmania with 2.1%.
- The largest rise in full-time student participation rates is evident for 17-year olds, with numbers increasing by approximately 57% since 1986.
- Proportions of male teaching staff has declined in every state since 1986.
For more information on schools, please view publication Schools, Australia 2006 (cat.no.4221.0). |
Recently Released Publications
Discover the ABS, 2006 to 2008 (cat.no.1303.0)
This is the first issue of the publication. It provides an overview of the ABS' role, and the products and services it provides. 'Discover the ABS' functions as a useful navigation tool about the resources available, and is a good starting point for developing a greater understanding of how you can utilise ABS data to benefit your decision making.
Retail and Wholesale Industries, Australia, 2005-06 (cat no. 8622.0)
The Retail and Wholesale Industry Survey collects information about the operation and financial performance of all businesses in the public trading and private employing sectors of the Australian economy. The survey provides "economic indicator" statistics which monitor the economy in regard to the business cycle. It is used as an annual benchmark of economic activity in the compilation of the National Accounts. The survey focuses on key business performance measures including expenditure/income, employment, operating profit and commodities.
 Print Page
 Print All