ABOUT THIS PUBLICATION
This publication contains information on housing motivations and intentions obtained from the October 2004 State Supplementary Survey, Housing Motivations and Intentions, Queensland. It presents information on household composition, dwelling and tenure type, and whether modifications have been made to the dwelling for older people or people with a disability. For households that have moved within the last three years, reasons for choosing to live in their current dwelling and reasons for moving from their previous dwelling are reported. Also included are all reasons households are not likely to move in the next 12 months but want to move by certain selected characteristics such as age, household income, and labour force status.
Other current publications and products released by the Australian Bureau of Statistics (ABS) are listed in the Catalogue of Publications and Products, (cat. no. 1101.0). The Catalogue is available from any ABS office or the ABS web site. The ABS also issues a daily Release Advice on the web site which details products to be released in the week ahead.
EFFECTS OF ROUNDING
Where figures have been rounded, discrepancies may occur between totals and the sums of the component items. Published percentages are calculated prior to rounding of the figures and therefore some discrepancy may occur between these percentages and those that could be calculated from the rounded figures.
ABBREVIATIONS AND SYMBOLS
ABS Australian Bureau of Statistics
Qld Queensland
MPS Monthly Population Survey
MSR major statistical region
RSE relative standard error
SE standard error
INQUIRIES
For further information about these and related statistics, contact the National Information and Referral Service on 1300 135 070 or Kylie Lane on Brisbane (07) 3222 6168.
SUMMARY OF FINDINGS
MOVERS - SELECTED CHARACTERISTICS
In October 2004, an estimated 443,800 households in Queensland had moved residence together in the previous three years. These households represented 30% of all households that resided in Queensland. Similar proportions of households within the Brisbane Major Statistical Region (MSR) and the Balance of Queensland MSR had moved (27% and 32% respectively). Proportionally, households that resided in a flat, unit or apartment were more likely to have moved (46%) compared with those residing in a separate house (26%).
Household type
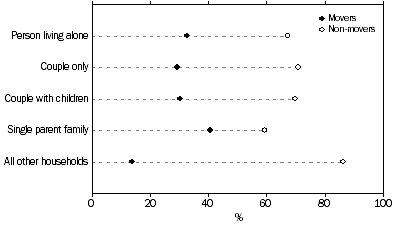
In Queensland, the household types most likely to have moved in the previous three years were single parent families (41%), persons living alone (33%) and couples with children (30%). For single parent families, important reasons for moving from the previous residence were a change in family circumstance, including divorce, (29%) and their mortgage or rent being too high (16%).
Household income
Similar proportions of movers were found across the different income ranges of Queensland households. Nearly one-third (31%) of those with an income range of $37,000 to $55,999 had moved in the previous three years, whilst households earning less than $37,000 and those earning $56,000 or more had the same proportion of movers at 30%.
Labour force status
Households containing at least one unemployed person reported a higher proportion of movers (45%) than households containing at least one employed person (33%) and households containing at least one person not in the labour force (22%). Main reasons given by all households for moving into their current dwelling were to move closer to work or to improve employment prospects, and to live in a better area (both 19%).
Non-movers
In October 2004, there were an estimated 1,051,800 households in Queensland that did not move residence in the previous three years. Households within the Brisbane MSR had 73% non-movers compared with 68% within the Balance of Queensland MSR. A higher proportion of households residing in a separate house were non-movers (74%) compared with those residing in a flat, unit or apartment (54%).
The household types with the highest proportion of non-movers were couples only (71%) and couples with children (70%). As with movers, the proportions of households that had not moved were similar across income ranges (around 70%). Households which contained employed persons and persons not in the labour force reported the highest proportions of non-movers (67% and 78% respectively).
MOVERS AND NON-MOVERS, by household type, Queensland

DWELLING TYPE AND TENURE TYPE
Most Queensland households (1,003,900) owned their current dwelling, either with or without a mortgage, whilst 468,100 households were renting. The highest proportion of non-movers (87%) was recorded by owners without a mortgage. This compared with non-mover households paying off their home (71%) and renter households (53%).
Of the 1,051,800 non-mover households, a higher proportion of households residing in a separate house were non-movers (74%) compared with 54% of non-mover households residing in a flat,unit or apartment.
The highest proportion of households that moved were households living in a flat, unit or apartment (46%) compared with 26% of households living in a separate house.
Of the 56,200 households which rent and live in a semi-detached, terrace or town house over half (53%) have moved within the last three years, while 47% have not moved.
DWELLING MODIFICATIONS
Households were asked if they had made modifications to their residence to suit older persons or persons with a disability. In Queensland, 7% (107,900) of households made modifications for these reasons. Households that reported modifications were more likely to be owners without a mortgage (62%) and persons living alone (38%). The household type with the lowest proportion of modifications was couples with children (3%).
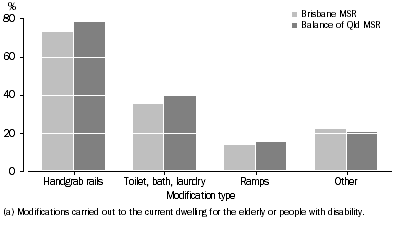
The most common modifications to the property were the installation of handgrab rails (76%), toilet, bath and laundry alterations (38%), and the addition of ramps (15%). Nearly three-quarters (73%) of households in the Brisbane MSR with modifications reported installing handgrab rails, compared with 78% in the Balance of Queensland MSR.
DWELLING MODIFICATION TYPE(a), by Queensland major statistical region

REASONS FOR CHOOSING THE CURRENT DWELLING
Mover households could nominate more than one reason for choosing to live in their current dwelling. The most common reason was to live close to work and employment prospects (34%). Mover households with people in the prime working age groups of 25 to 34 years and 35 to 44 years were the highest contributors (34% and 29% respectively).
Other frequently reported reasons for choosing to live in the current dwelling were to live near family and friends (26%), to live in a better area (24%) and to move into a bigger or smaller home (12%).
REASONS FOR MOVING FROM THE PREVIOUS DWELLING
Households were asked to nominate reasons for moving from their previous dwelling; more than one reason could be nominated. The most common reason stated for moving was to live in a better area (39%). For households nominating this reason, the most common household income range was $56,000 or more. The most common household types that moved for this reason were couples with children (36%), followed by couples only (27%).
The next most common reason nominated by households for moving from their previous residence was that it was not suitable (30%). The most common household type to move for this reason was couple families with children (39%).
REASONS FOR NOT MOVING
Households that stated they were not likely to move in the next 12 months, but indicated they would like to move, were asked to provide reasons for not moving. The most common reason given for not moving was that they could not afford a new dwelling (54%). For households nominating this reason, the most common income range was less than $37,000 (44%). The most common household type who could not afford a new dwelling was couples with children (32%).
 Print Page
 Print All