This reissue contains amended data for the March Quarter 2006 (see "Changes in this Issue" below).
MARCH QUARTER KEY FIGURES
 | Dec Qtr 05 to Mar Qtr 06 | Mar Qtr 05 to Mar Qtr 06 |
 | % change | % change |
|
| Import Price Index all groups | 1.3 | 6.2 |
| Food and live animals | 0.6 | 7.3 |
| Beverages and tobacco | -0.8 | 6.8 |
| Crude materials | 1.3 | 8.5 |
| Mineral fuels, etc. | 7.1 | 53.7 |
| Animal and vegetable oils, etc. | 4.8 | 21.2 |
| Chemicals and related products | -0.8 | 1.4 |
| Manufactured goods by material | 1.8 | 3.8 |
| Machinery and transport equipment | -0.2 | -0.9 |
| Miscellaneous manufactured articles | 1.5 | 3.0 |
| Commodities and transactions n.e.s. | 14.5 | 36.5 |
| Export Price Index all groups | 5.0 | 22.7 |
| Food and live animals | 2.4 | 6.9 |
| Beverages and tobacco | 0.6 | 2.3 |
| Crude materials | 5.3 | 26.0 |
| Mineral fuels, etc. | 3.2 | 48.6 |
| Chemicals and related products | 4.7 | 13.4 |
| Manufactured goods by material | 13.2 | 20.4 |
| Machinery and transport equipment | 0.7 | 3.8 |
| Miscellaneous manufactured articles | 1.2 | 7.7 |
|
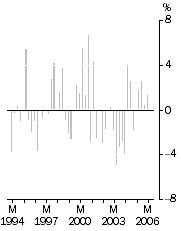
IMPORT PRICE INDEX: all groups, Quarterly % change

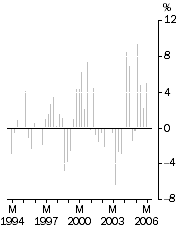
| Export Price Index: all groups, Quarterly % change

|
MARCH QUARTER KEY POINTS
IMPORT PRICE INDEX
- The Import Price Index increased by 1.3% in the March quarter 2006, following a 0.4% increase in the December quarter 2005. Crude and other petroleum oils were the main contributors to the increase. The most significant offsetting price decreases were for imports of chemical products and medicaments. Through the year to March quarter 2006, the IPI rose 6.2%.
EXPORT PRICE INDEX
- The Export Price Index increased by 5.0% in the March quarter 2006, following a 2.2% increase in the December quarter 2005. The increase this quarter was driven by price rises for aluminium, gold, alumina, crude petroleum oils, copper ores and concentrates, refined copper and alloys, and zinc. The most significant offsetting price decreases were for exports of medicaments and fresh and frozen edible offal. Through the year to March quarter 2006, the EPI rose 22.7%.
NOTES
FORTHCOMING ISSUES
| ISSUE (QUARTER) | Release Date |
| June 2006 | 21 July 2006 |
| September 2006 | 20 October 2006 |
CHANGES IN THIS ISSUE
This publication contains amended data for the March quarter 2006 import and export price indexes to correct for processing errors. All component groups of the import price index were affected. The only export price index groups affected were "Mineral fuels, lubricants and other related materials" and "All groups".
The revisions to the international trade price indexes also affect several components of the producer price indexes. Together, the changes in the different indexes will cause revisions to the March quarter 2006 national accounts estimates, with the largest impact being on the volume of imports of goods and services. These revisions will be reflected in the June quarter 2006 issues of Australian National Accounts: National Income, Expenditure and Product (cat. no. 5206.0) and Balance of Payments and International Investment Position, Australia (cat. no. 5302.0). The indexes enter into the compilation of the national accounts in many different ways, some of which offset. In isolation, the net effect of the revisions would cause the seasonally adjusted GDP chain volume measure of quarterly growth for March quarter 2006 to be revised from 0.9% to 0.8%. However, there will also be a range of other revisions to the national accounts estimates, for example those coming from updated source data. This means that the actual results published for GDP growth for March quarter 2006 in the June quarter 2006 Australian National Accounts: National Income, Expenditure and Product (cat. no. 5206.0), to be released on 6 September 2006, may differ from the above.
ROUNDING
Any discrepancies between totals and sums of components in this publication are due to rounding.
RELATED STATISTICS
For more information about statistics in this publication contact Steve Whennan on (02) 6252 6251, or email <steve.whennan@abs.gov.au>.
INQUIRIES
For further information about these and related statistics, contact the National Information and Referral Service on 1300 135 070 or Steve Whennan on Canberra (02) 6252 6251.
 Print Page
 Print All