JULY KEY FIGURES
 | | Jul 06 | Jun 06 to Jul 06 | Jul 05 to Jul 06 |
| | no. | % change | % change |
|
| TREND | | | |
| Total dwelling units approved | 13 431 | 2.4 | 3.1 |
| Private sector houses | 8 729 | 0.3 | -1.2 |
| Private sector other dwellings | 4 441 | 7.2 | 14.7 |
| SEASONALLY ADJUSTED | | | |
| Total dwelling units approved | 14 288 | 8.3 | 9.1 |
| Private sector houses | 8 860 | 4.9 | 1.1 |
| Private sector other dwellings | 5 149 | 15.4 | 27.2 |
|
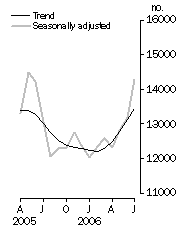
Dwelling units approved, Total number
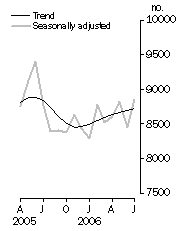
| Private sector houses approved, Total number
|
JULY KEY POINTS
TOTAL DWELLING UNITS
- The trend estimate for total dwelling approvals rose 2.4% in July 2006.
- The seasonally adjusted estimate for total dwelling units approved rose 8.3%, to 14,288, in July 2006.
PRIVATE SECTOR HOUSES
- The trend estimate for private sector house approvals rose 0.3% in July 2006.
- The seasonally adjusted estimate for private sector houses approved rose 4.9%, to 8,860, in July 2006.
PRIVATE SECTOR OTHER DWELLING UNITS
- The trend estimate for private sector other dwellings approved rose 7.2% in July 2006.
- The seasonally adjusted estimate for private sector other dwellings approved rose 15.4%, to 5,149, in July 2006. This follows a rise of 17.2% in the previous month.
VALUE OF BUILDING APPROVED
- The trend estimate for the value of total building approved rose 2.1% in July 2006. The value of new residential building rose 1.7% and the value of alterations and additions rose 0.3%. The trend for the value of non-residential building approved rose 3.0% in July 2006.
- The seasonally adjusted estimate for the value of total building approved fell 6.3%, to $5,514.6m, in July 2006. The value of new residential building approved rose 2.9%, to $2,745.4m. The value of alterations and additions fell 14.4%, to $470.1m. The value of non-residential building fell 13.9%, to $2,299.1m.
NOTES
CHANGES IN THIS ISSUE
A new base year, 2004-05, has been introduced into the chain volume estimates which has resulted in revisions to growth rates in subsequent periods. In addition, the chain volume estimates have been re-referenced to 2004-05, thereby preserving additivity in the quarters after the reference year. Re-referencing affects the levels of, but not the movements in, chain volume estimates.
REVISIONS THIS MONTH
Revisions to Total Dwellings in this issue are:
| 2005-06 |
|
| NSW | 83 |
| Vic. | 10 |
| Qld | 4 |
| SA | 2 |
| WA | -15 |
| Tas. | - |
| NT | -1 |
| ACT | - |
| Total | 83 |
|
DATA NOTES
New Statistical Divisions have been created in Queensland and have been incorporated into this publication. This has caused a break in series in Brisbane Statistical Division in Table 8. Details of these new Statistical Divisions are listed in the publication Australian Standard Geographical Classification (ASGC), 2006 Edition (cat. no. 1216.0), Appendix 2.
INQUIRIES
For further information about these and related statistics, contact the National Information and Referral Service on 1300 135 070 or Paul Pamment on Adelaide (08) 8237 7499.
VALUE OF BUILDING APPROVED
NEW RESIDENTIAL BUILDING
The trend for the value of new residential building has risen for the last eight months.
ALTERATIONS AND ADDITIONS TO RESIDENTIAL BUILDING
The trend for the value of alterations and additions is now showing small rises for the last four months.
NON-RESIDENTIAL BUILDING
The trend estimate for the value of non-residential building rose 3.0% in July 2006, and is now showing strong growth for the last four months.
DWELLINGS APPROVED
TOTAL DWELLING UNITS
The trend estimate for total dwelling units approved has risen for the last five months.
PRIVATE SECTOR HOUSES
The trend estimate for private sector houses approved shows small rises for eight consecutive months.
PRIVATE SECTOR OTHER DWELLINGS
The trend estimate for private sector other dwellings approved has had strong rises for the last four months.
DWELLING UNITS APPROVED STATES AND TERRITORIES
SUMMARY COMMENTS
The trend estimate for total dwelling units approved rose 2.4% in July 2006. The trend rose in all states and territories except Western Australia which was flat. The largest rises were in the Australian Capital Territory (+9.0%) and Victoria (+4.0%).
The trend estimate for private sector houses approved rose 0.3% in July 2006. The trend rose in New South Wales (+2.3%), Queensland (+0.6%) and South Australia (+1.0%), but fell in Victoria (-0.4%) and Western Australia (-1.3%).
| | NSW | Vic. | Qld | SA | WA | Tas. | NT | ACT | Aust. | |
Original | |
| |
| Dwelling units approved | | | | | | | | | | |
| Private sector houses (no.) | 1 475 | 2 532 | 2 331 | 715 | 1 761 | 210 | 71 | 88 | 9 183 | |
| Total dwelling units (no.) | 2 482 | 3 607 | 3 538 | 1 055 | 2 708 | 246 | 187 | 224 | 14 047 | |
| Percentage change from previous month | | | | | | | | | | |
| Private sector houses (%) | -1.9 | -0.2 | 4.6 | 9.8 | 6.0 | 5.5 | 54.3 | -17.0 | 2.8 | |
| Total dwelling units (%) | -20.3 | 8.9 | -2.6 | 16.1 | 29.6 | -10.2 | 125.3 | 10.3 | 3.2 | |
Seasonally Adjusted | |
| |
| Dwelling units approved | | | | | | | | | | |
| Private sector houses (no.) | 1 480 | 2 375 | 2 171 | 705 | 1 746 | na | na | na | 8 860 | |
| Total dwelling units (no.) | 2 565 | 4 054 | 3 377 | 979 | 2 636 | 252 | na | na | 14 288 | |
| Percentage change from previous month | | | | | | | | | | |
| Private sector houses (%) | 15.6 | 4.8 | -0.3 | 13.8 | 0.2 | na | na | na | 4.9 | |
| Total dwelling units (%) | -18.8 | 32.0 | 0.6 | 3.2 | 25.0 | -4.9 | na | na | 8.3 | |
Trend | |
| |
| Dwelling units approved | | | | | | | | | | |
| Private sector houses (no.) | 1 373 | 2 367 | 2 188 | 658 | 1 783 | na | na | na | 8 729 | |
| Total dwelling units (no.) | 2 768 | 3 519 | 3 362 | 968 | 2 261 | 251 | 92 | 218 | 13 431 | |
| Percentage change from previous month | | | | | | | | | | |
| Private sector houses (%) | 2.3 | -0.4 | 0.6 | 1.0 | -1.3 | na | na | na | 0.3 | |
| Total dwelling units (%) | 3.1 | 4.0 | 2.0 | 0.9 | - | 3.3 | 1.1 | 9.0 | 2.4 | |
| |
| - nil or rounded to zero (including null cells) |
| na not available |
DWELLING UNITS APPROVED
STATE TRENDS
NEW SOUTH WALES
The trend for total dwelling units approved in New South Wales has risen for the last four months after being in decline for the previous thirteen months. The trend estimate for private sector houses has risen for the last six months.
VICTORIA
The trend for total dwelling units approved in Victoria is now showing strong rises for the last four months. The trend for private sector houses has fallen for the last eight months.
QUEENSLAND
The trend for total dwelling units approved in Queensland has risen for the last six months. The trend for private sector houses has risen for the last eight months.
SOUTH AUSTRALIA
The trend for total dwelling units approved in South Australia has risen for the last six months. The trend for private sector houses is now showing rises for the last three months.
WESTERN AUSTRALIA
The trend estimate for total dwelling units approved in Western Australia has been flat for the last six months. The trend for private sector houses is now showing falls for the last three months.
 Print Page
 Print All