(a) Seasonally adjusted numbers of new motor vehicle sales in Tasmania, Northern Territory and Australian Capital Territory should be used with caution. For more information, see paragraph 7 of the Explanatory Notes.
JANUARY TREND ESTIMATES KEY POINTS
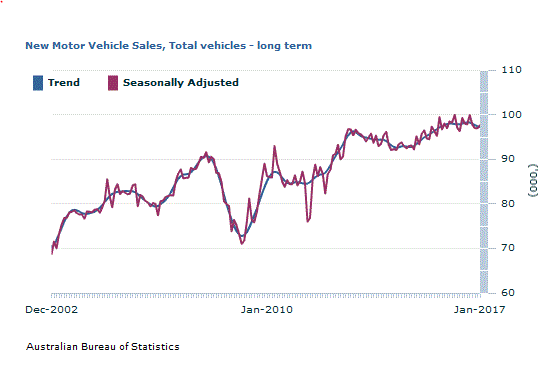
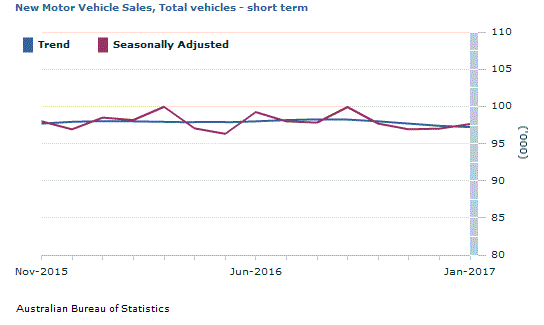
The January 2017 trend estimate (97,231) decreased by 0.2% when compared with December 2016.
When comparing national trend estimates for January 2017 with December 2016, sales for Sports utility and Other vehicles decreased by 0.7% and and 0.4% respectively. By contrast, sales for Passenger vehicles increased by 0.4%.
The largest downward movement across all states and territories, on a trend basis, was in Tasmania (-1.8%).
The largest upward movement across all states and territories, on a trend basis, was in the Australian Capital Territory (1.0%), continuing an upward trend which commenced in September 2016.
New motor vehicle sales by type of vehicle by month
Count Passenger vehicles
Count Sports utility vehicles
Count Other vehicles
Count Total vehicles
Change Passenger vehicles
Change Sports utility vehicles
Change Other vehicles
Change Total vehicles
no.
no.
no.
no.
%
%
%
%
Trend
2015
November
41 894
36 086
19 720
97 701
-1.1
0.8
2.2
0.3
December
41 473
36 221
20 220
97 915
-1.0
0.4
2.5
0.2
2016
January
41 115
36 248
20 663
98 026
-0.9
0.1
2.2
0.1
February
40 878
36 177
20 955
98 009
-0.6
-0.2
1.4
-
March
40 785
36 061
21 068
97 914
-0.2
-0.3
0.5
-0.1
April
40 779
36 003
21 070
97 852
-
-0.2
-
-0.1
May
40 745
36 106
21 000
97 851
-0.1
0.3
-0.3
-
June
40 629
36 475
20 883
97 986
-0.3
1.0
-0.6
0.1
July
40 382
36 981
20 797
98 161
-0.6
1.4
-0.4
0.2
August
40 071
37 420
20 788
98 278
-0.8
1.2
-
0.1
September
39 826
37 604
20 794
98 224
-0.6
0.5
-
-0.1
October
39 692
37 524
20 766
97 982
-0.3
-0.2
-0.1
-0.2
November
39 661
37 310
20 707
97 678
-0.1
-0.6
-0.3
-0.3
December
39 675
37 072
20 641
97 388
-
-0.6
-0.3
-0.3
2017
January
39 837
36 831
20 563
97 231
0.4
-0.7
-0.4
-0.2
Seasonally Adjusted
2015
November
41 992
35 595
20 403
97 990
1.8
-0.8
4.4
1.3
December
42 341
35 436
19 140
96 916
0.8
-0.4
-6.2
-1.1
2016
January
40 357
37 000
21 148
98 505
-4.7
4.4
10.5
1.6
February
40 676
36 570
20 908
98 154
0.8
-1.2
-1.1
-0.4
March
41 574
36 404
21 975
99 953
2.2
-0.5
5.1
1.8
April
40 984
35 322
20 743
97 049
-1.4
-3.0
-5.6
-2.9
May
39 969
35 821
20 536
96 325
-2.5
1.4
-1.0
-0.7
June
42 399
36 142
20 704
99 245
6.1
0.9
0.8
3.0
July
40 109
36 767
21 128
98 004
-5.4
1.7
2.0
-1.3
August
39 395
37 644
20 778
97 817
-1.8
2.4
-1.7
-0.2
September
40 193
38 665
21 040
99 898
2.0
2.7
1.3
2.1
October
39 374
38 196
20 117
97 687
-2.0
-1.2
-4.4
-2.2
November
39 070
36 837
21 020
96 927
-0.8
-3.6
4.5
-0.8
December
40 529
35 422
21 062
97 012
3.7
-3.8
0.2
0.1
2017
January
39 822
37 667
20 146
97 636
-1.7
6.3
-4.3
0.6
Original
2015
November
41 726
36 070
20 843
98 639
2.1
3.8
11.3
4.6
December
44 172
35 439
20 005
99 616
5.9
-1.7
-4.0
1.0
2016
January
35 214
33 073
16 086
84 373
-20.3
-6.7
-19.6
-15.3
February
39 558
36 865
20 020
96 443
12.3
11.5
24.5
14.3
March
43 652
38 437
22 423
104 512
10.3
4.3
12.0
8.4
April
36 671
31 783
19 117
87 571
-16.0
-17.3
-14.7
-16.2
May
38 222
36 230
22 220
96 672
4.2
14.0
16.2
10.4
June
53 832
46 011
28 726
128 569
40.8
27.0
29.3
33.0
July
38 033
33 817
19 481
91 331
-29.3
-26.5
-32.2
-29.0
August
38 945
36 396
19 568
94 909
2.4
7.6
0.4
3.9
September
42 076
39 497
21 123
102 696
8.0
8.5
7.9
8.2
October
37 817
36 442
19 098
93 357
-10.1
-7.7
-9.6
-9.1
November
39 852
37 536
21 549
98 937
5.4
3.0
12.8
6.0
December
42 385
34 936
21 442
98 763
6.4
-6.9
-0.5
-0.2
2017
January
34 920
34 127
15 863
84 910
-17.6
-2.3
-26.0
-14.0
- nil or rounded to zero (including null cells)
New motor vehicle sales by state/territory of registration
NSW
Vic.
Qld
SA
WA
Tas.(a)
NT(a)
ACT(a)
Aust.
Trend
2015
November
32 547
26 674
19 829
5 881
8 836
1 594
831
1 509
97 701
December
32 684
26 694
19 798
5 956
8 848
1 589
847
1 499
97 915
2016
January
32 879
26 692
19 702
5 995
8 802
1 583
868
1 505
98 026
February
33 066
26 679
19 580
5 995
8 704
1 570
891
1 525
98 009
March
33 187
26 680
19 482
5 965
8 590
1 554
909
1 547
97 914
April
33 203
26 752
19 431
5 942
8 491
1 549
921
1 562
97 852
May
33 144
26 896
19 399
5 931
8 431
1 563
925
1 562
97 851
June
33 074
27 152
19 362
5 931
8 400
1 602
920
1 546
97 986
July
33 033
27 412
19 307
5 948
8 370
1 655
909
1 527
98 161
August
33 051
27 598
19 231
5 968
8 316
1 702
895
1 519
98 278
September
33 090
27 688
19 108
5 978
8 222
1 732
880
1 526
98 224
October
33 094
27 697
18 968
5 976
8 097
1 741
866
1 544
97 982
November
33 070
27 675
18 847
5 971
7 970
1 728
854
1 563
97 678
December
33 045
27 650
18 737
5 965
7 860
1 704
846
1 581
97 388
2017
January
33 035
27 676
18 677
5 959
7 771
1 673
842
1 597
97 231
Seasonally Adjusted
2015
November
32 539
26 582
20 263
5 831
8 894
1 562
803
1 516
97 990
December
32 012
27 010
19 199
5 912
8 823
1 690
833
1 437
96 916
2016
January
32 811
26 558
20 197
6 143
8 903
1 578
837
1 479
98 505
February
33 300
26 687
19 572
5 952
8 722
1 493
935
1 493
98 154
March
33 987
26 743
20 365
6 042
8 702
1 568
932
1 613
99 953
April
33 043
26 867
18 867
5 753
8 448
1 587
893
1 591
97 049
May
32 769
26 214
19 197
6 018
8 054
1 582
934
1 557
96 325
June
33 014
27 618
20 054
5 955
8 388
1 541
936
1 739
99 245
July
32 895
27 183
19 450
5 806
8 713
1 567
872
1 518
98 004
August
32 906
27 665
18 853
6 012
8 289
1 718
916
1 459
97 817
September
33 695
28 060
19 206
6 241
8 336
1 875
918
1 566
99 898
October
33 351
27 876
18 678
5 696
7 998
1 775
816
1 496
97 687
November
32 118
27 775
19 129
6 026
7 771
1 690
857
1 561
96 927
December
33 457
26 427
18 931
6 043
7 972
1 670
838
1 674
97 012
2017
January
33 056
28 490
18 379
5 891
7 799
1 615
859
1 547
97 636
Original
2015
November
33 176
27 421
19 249
6 019
8 724
1 764
734
1 552
98 639
December
32 740
27 785
19 711
6 315
8 969
1 913
733
1 450
99 616
2016
January
28 392
22 426
17 193
5 208
7 861
1 298
626
1 369
84 373
February
32 633
26 782
18 711
5 988
8 725
1 319
851
1 434
96 443
March
35 963
27 716
21 470
6 087
9 054
1 515
1 023
1 684
104 512
April
29 391
23 963
17 753
5 174
7 601
1 313
969
1 407
87 571
May
32 867
26 125
19 565
5 949
7 935
1 503
1 180
1 548
96 672
June
43 449
34 262
27 270
7 613
10 749
1 853
1 240
2 133
128 569
July
30 219
25 517
18 445
5 210
8 234
1 389
831
1 486
91 331
August
31 788
27 096
18 062
5 785
8 144
1 743
881
1 410
94 909
September
34 424
28 766
19 702
6 551
8 668
2 074
880
1 631
102 696
October
31 850
27 546
16 870
5 450
7 580
1 937
713
1 411
93 357
November
32 955
28 991
18 733
6 259
7 657
1 903
808
1 631
98 937
December
33 632
27 065
19 252
6 464
8 026
1 918
734
1 672
98 763
2017
January
29 068
24 535
15 709
5 134
7 037
1 337
652
1 438
84 910
(a) Seasonally adjusted numbers of new motor vehicle sales in Tasmania, Northern Territory and Australian Capital Territory should be used with caution. For more information, see paragraph 7 of the Explanatory Notes.
NOTES
FORTHCOMING ISSUES
ISSUE
Release Date
February 2017
15 March 2017
March 2017
19 April 2017
April 2017
16 May 2017
May 2017
19 June 2017
June 2017
18 July 2017
July 2017
15 August 2017
ABOUT THIS ISSUE
This issue presents details for the Sales of New Motor Vehicles for January 2017.
INQUIRIES
For further information about these and related statistics, contact the National Information and Referral Service on 1300 135 070. The ABS Privacy Policy outlines how the ABS will handle any personal information that you provide to us.
Document Selection
These documents will be presented in a new window.
 Quality Declaration
  Print Page
 Print All